
Three heatwaves in June and July 2026, and a government announcement on a future "summer comfort rating" on 15 July: overheating in homes has shifted from a comfort issue to a health risk. But which homes are actually exposed? We analysed 11,183,219 energy performance certificates — the DPE (Diagnostic de Performance Énergétique), France's Energy Performance Certificate (EPC) — to find out.
The answer is one figure and one paradox. The figure: 40.2% of homes are rated "insufficient" for summer comfort by the surveyors themselves. The paradox: the official ranking of the most exposed cities is misleading — because it looks only at the building, never at where it stands.
40.2% of surveyed homes are declared "insufficient" for summer comfort — yet the official indicator puts the North on top, while the real overheating risk concentrates in the South and in Paris.
What this barometer covers
This OneDpe barometer crosses two readings of summer comfort over the same pool of EPCs: the declared indicator from the certificate (what the surveyor ticked) and the OneDpe Summer Score (Score Été, 0-100), which adds the local climate and the urban heat island. You will find the national distribution, the ranking of major cities under each measure, and above all what happens when you switch from one to the other.
Summer comfort in the EPC: one indicator, soon an official rating
Since the DPE was overhauled, every home energy certificate carries a summer comfort indicator on three levels — insufficient, average or good. It is defined in Annex 9 of the French order of 31 March 2021 on the DPE, and rests on five building features: the presence of solar shading (shutters, blinds, overhangs), roof insulation, thermal inertia (the ability of heavy walls to buffer heat), whether the home is dual-aspect (allowing cross-ventilation), and the presence of a ceiling fan.
This indicator is currently informative: it is neither binding nor tied to any ban, unlike the A-to-G energy performance letters. The framework is moving, though. France's third National Climate Change Adaptation Plan (PNACC-3) plans a finer, localised summer comfort indicator by 2028, based on discomfort degree-hours — a study by the CSTB (French building science centre) is under way. On 15 July 2026, the government floated a future "summer comfort rating"; at the time of this barometer, no text had been published or opened for consultation.
Key takeaway: today's summer comfort indicator describes the building, not its environment. Two identical homes, one in Lille, the other in Perpignan, receive the same indicator — even though the second will face far harsher summers.
Two ways to measure overheating risk
It is exactly this limitation that shapes our barometer. We measure summer comfort in two ways, over the same pool of EPCs.
1. The declared indicator: the building alone
The first measure is the insufficient / average / good indicator as entered in the EPCs. It is a factual figure: it reflects what surveyors observed on the five Annex 9 criteria. We measure it as a full census (all 9,663,670 certificates that fill it in, no sampling). Its strength: it is uncontestable. Its limit: it is blind to location. A well-shaded home earns a "good" indicator whether it sits in Brittany or in the Vaucluse.
2. The OneDpe Summer Score: the building and its climate
The second measure is the OneDpe Summer Score (0-100, where 100 = optimal comfort). It starts from the same building features, but adds two dimensions the official indicator ignores:
The local climate — drawn from Météo-France's CLIMADIAG projections by department: a summer in Perpignan is nothing like a summer in Lille.
The urban heat island (UHI) — the effect by which a dense, mineral city stays several degrees warmer than a neighbouring suburban or rural area, especially at night. We measure it at the address level, using the "Local Climate Zone", a morphological classification of the urban fabric.
The Summer Score is a proprietary, non-regulatory indicator, calibrated on the national stock (median 67 out of 100). Because it requires a home-by-home calculation, we measure it on a random sample of 2.5 million EPCs; on that same sample, the declared indicator gives rates identical to the census (under 1 point apart), which validates its representativeness.
Why we exclude certificates generated from the building
When a building has a collective EPC, the certificates of the dwellings inside it may be derived from it rather than drawn up one by one. Annex 9 § 9.1 does not provide for a summer comfort assessment there: an indicator appearing on such a certificate would be an anomaly. We therefore exclude them from the barometer — 4.16 million certificates, 27% of the stock.
A correction we owe you. An earlier version of this article stated that indicator coverage reached "86.3% for houses but only 55.8% for flats", and concluded that the national figure understated the problem. That was a counting artefact: certificates generated from a building-level EPC are by nature flats, and do not carry the indicator. Once they are excluded, houses and flats are level — 86.5% against 86.4%. We withdrew that conclusion on 2 August 2026.
13.6% of certificates still do not fill the indicator in: genuine non-completion. The direction of the resulting bias is not established: coverage is identical for houses (86.5%) and flats (86.4%), and nothing supports the claim that these unfilled certificates would be more — or less — often "insufficient" than the rest.
The official ranking says the North — the real risk says the South
Here is the heart of the barometer. Depending on the measure chosen, the map of the most exposed cities flips.
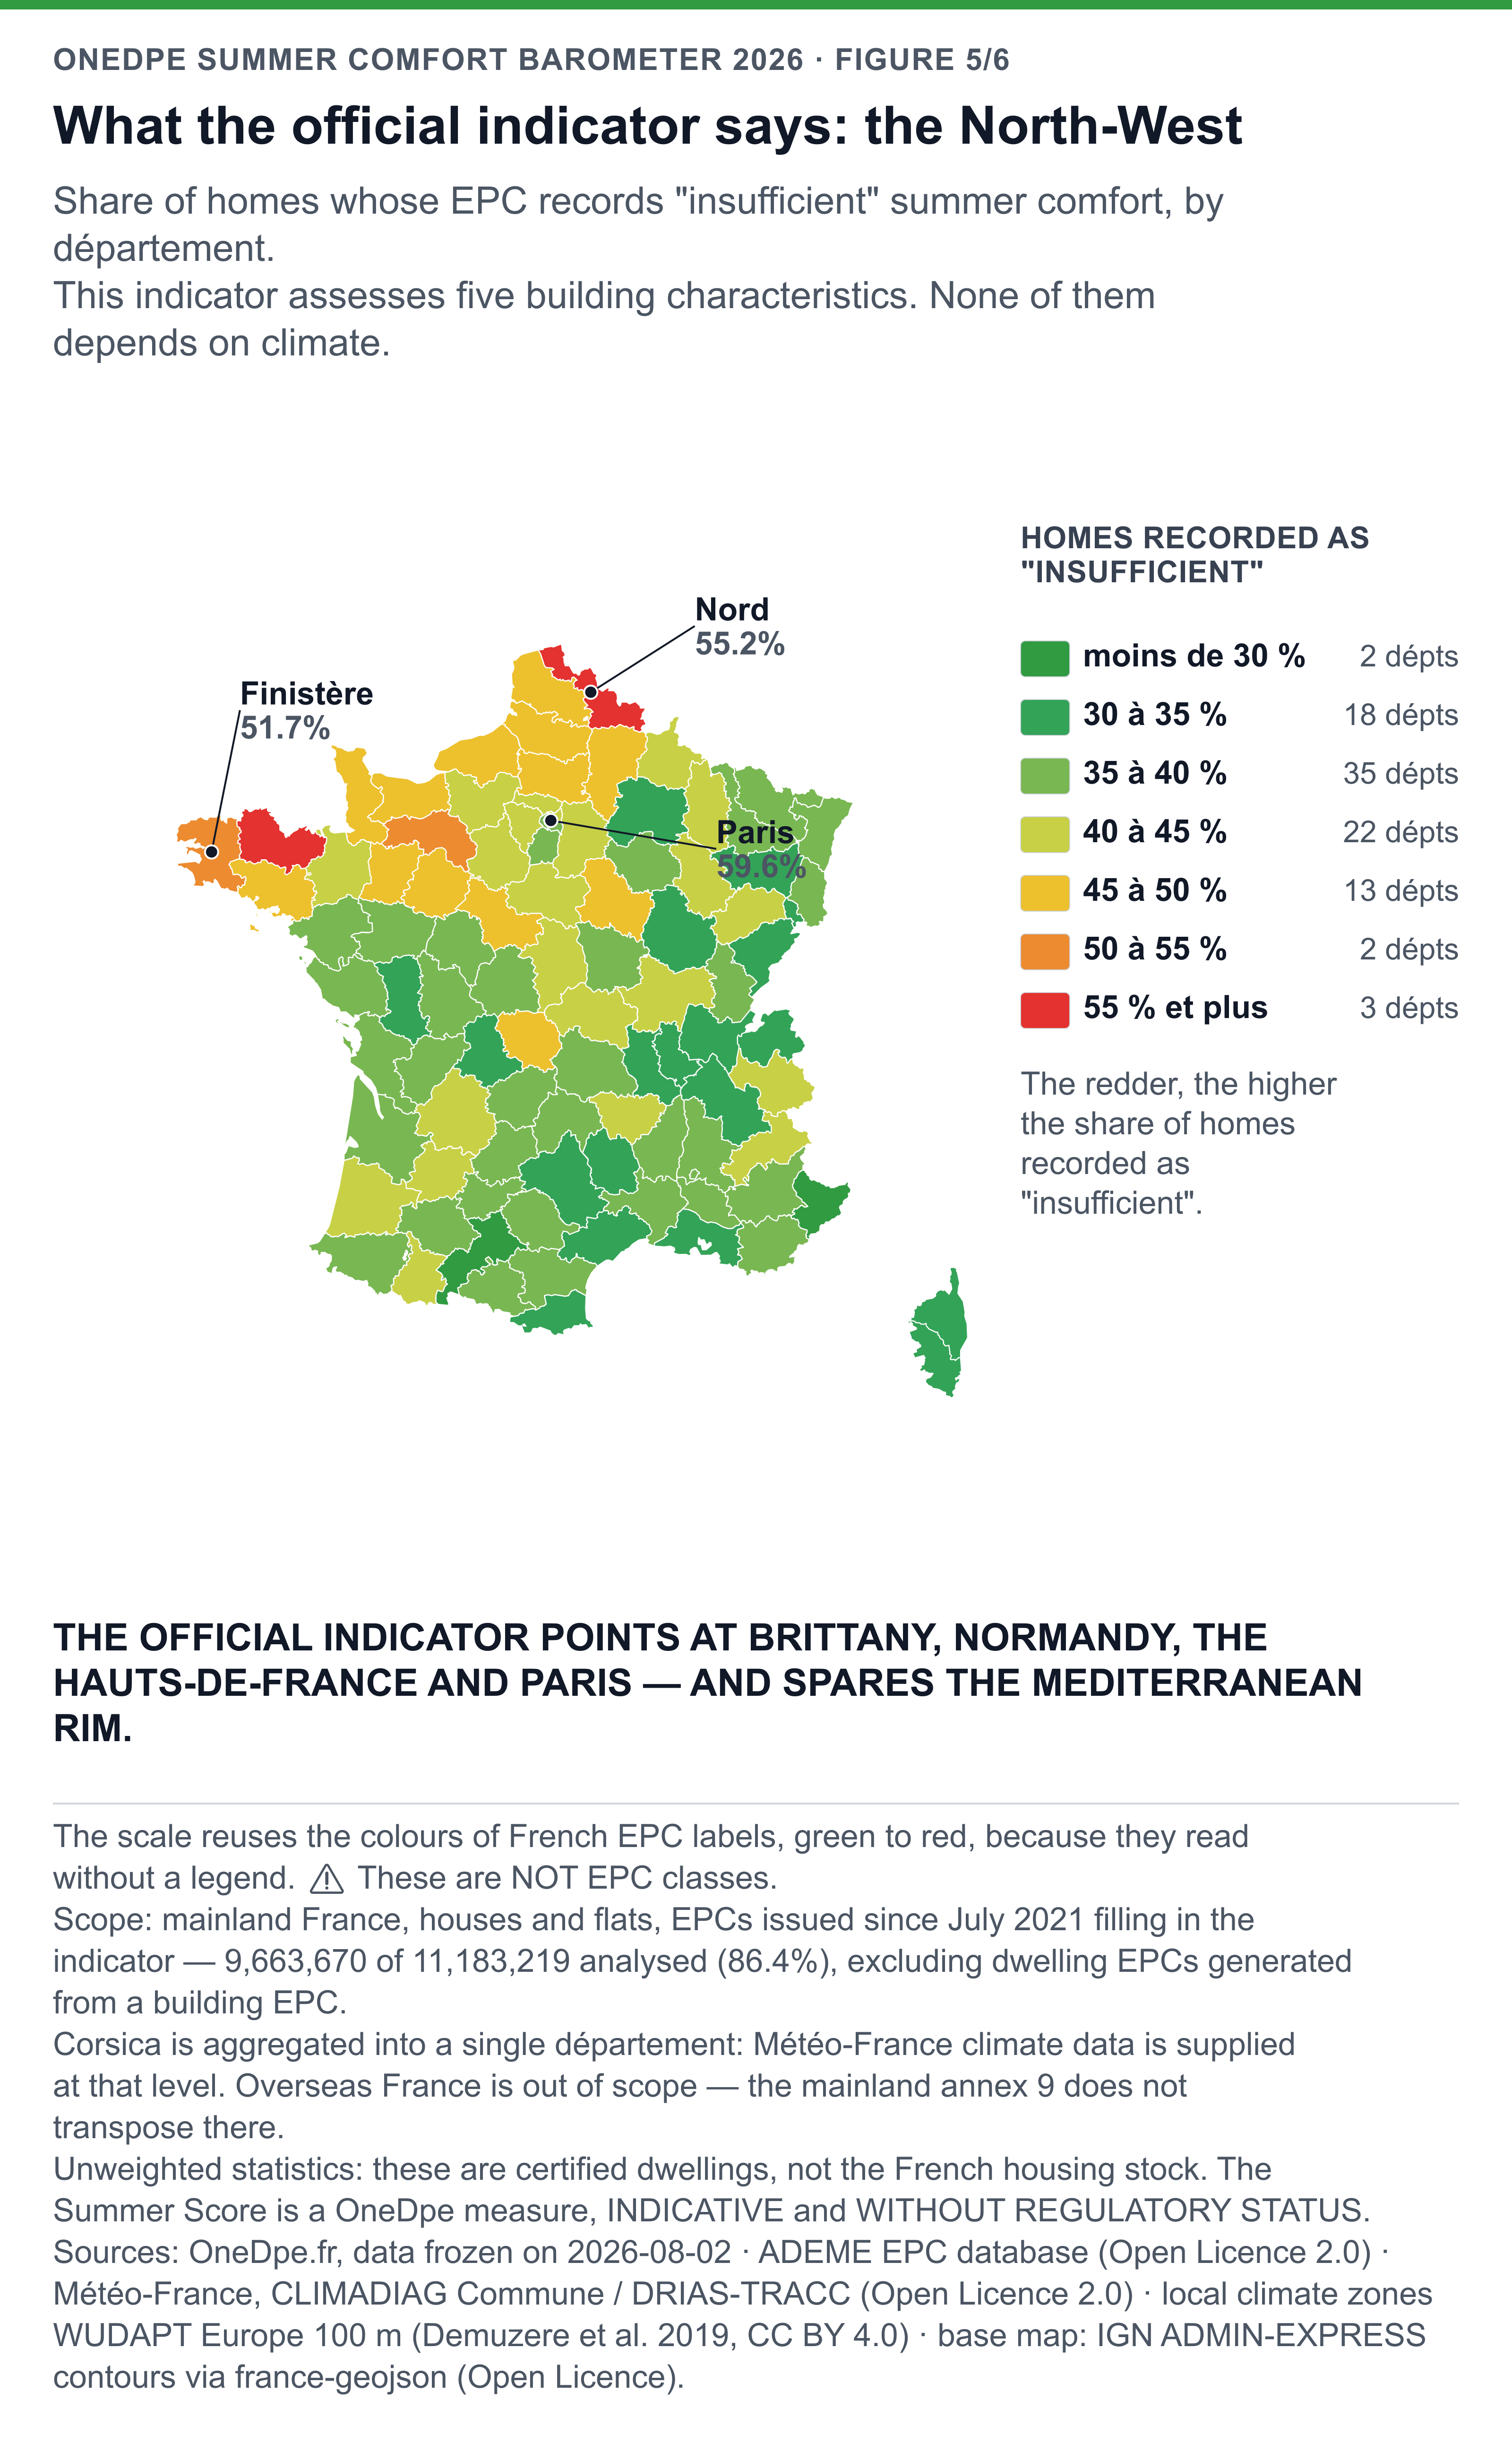
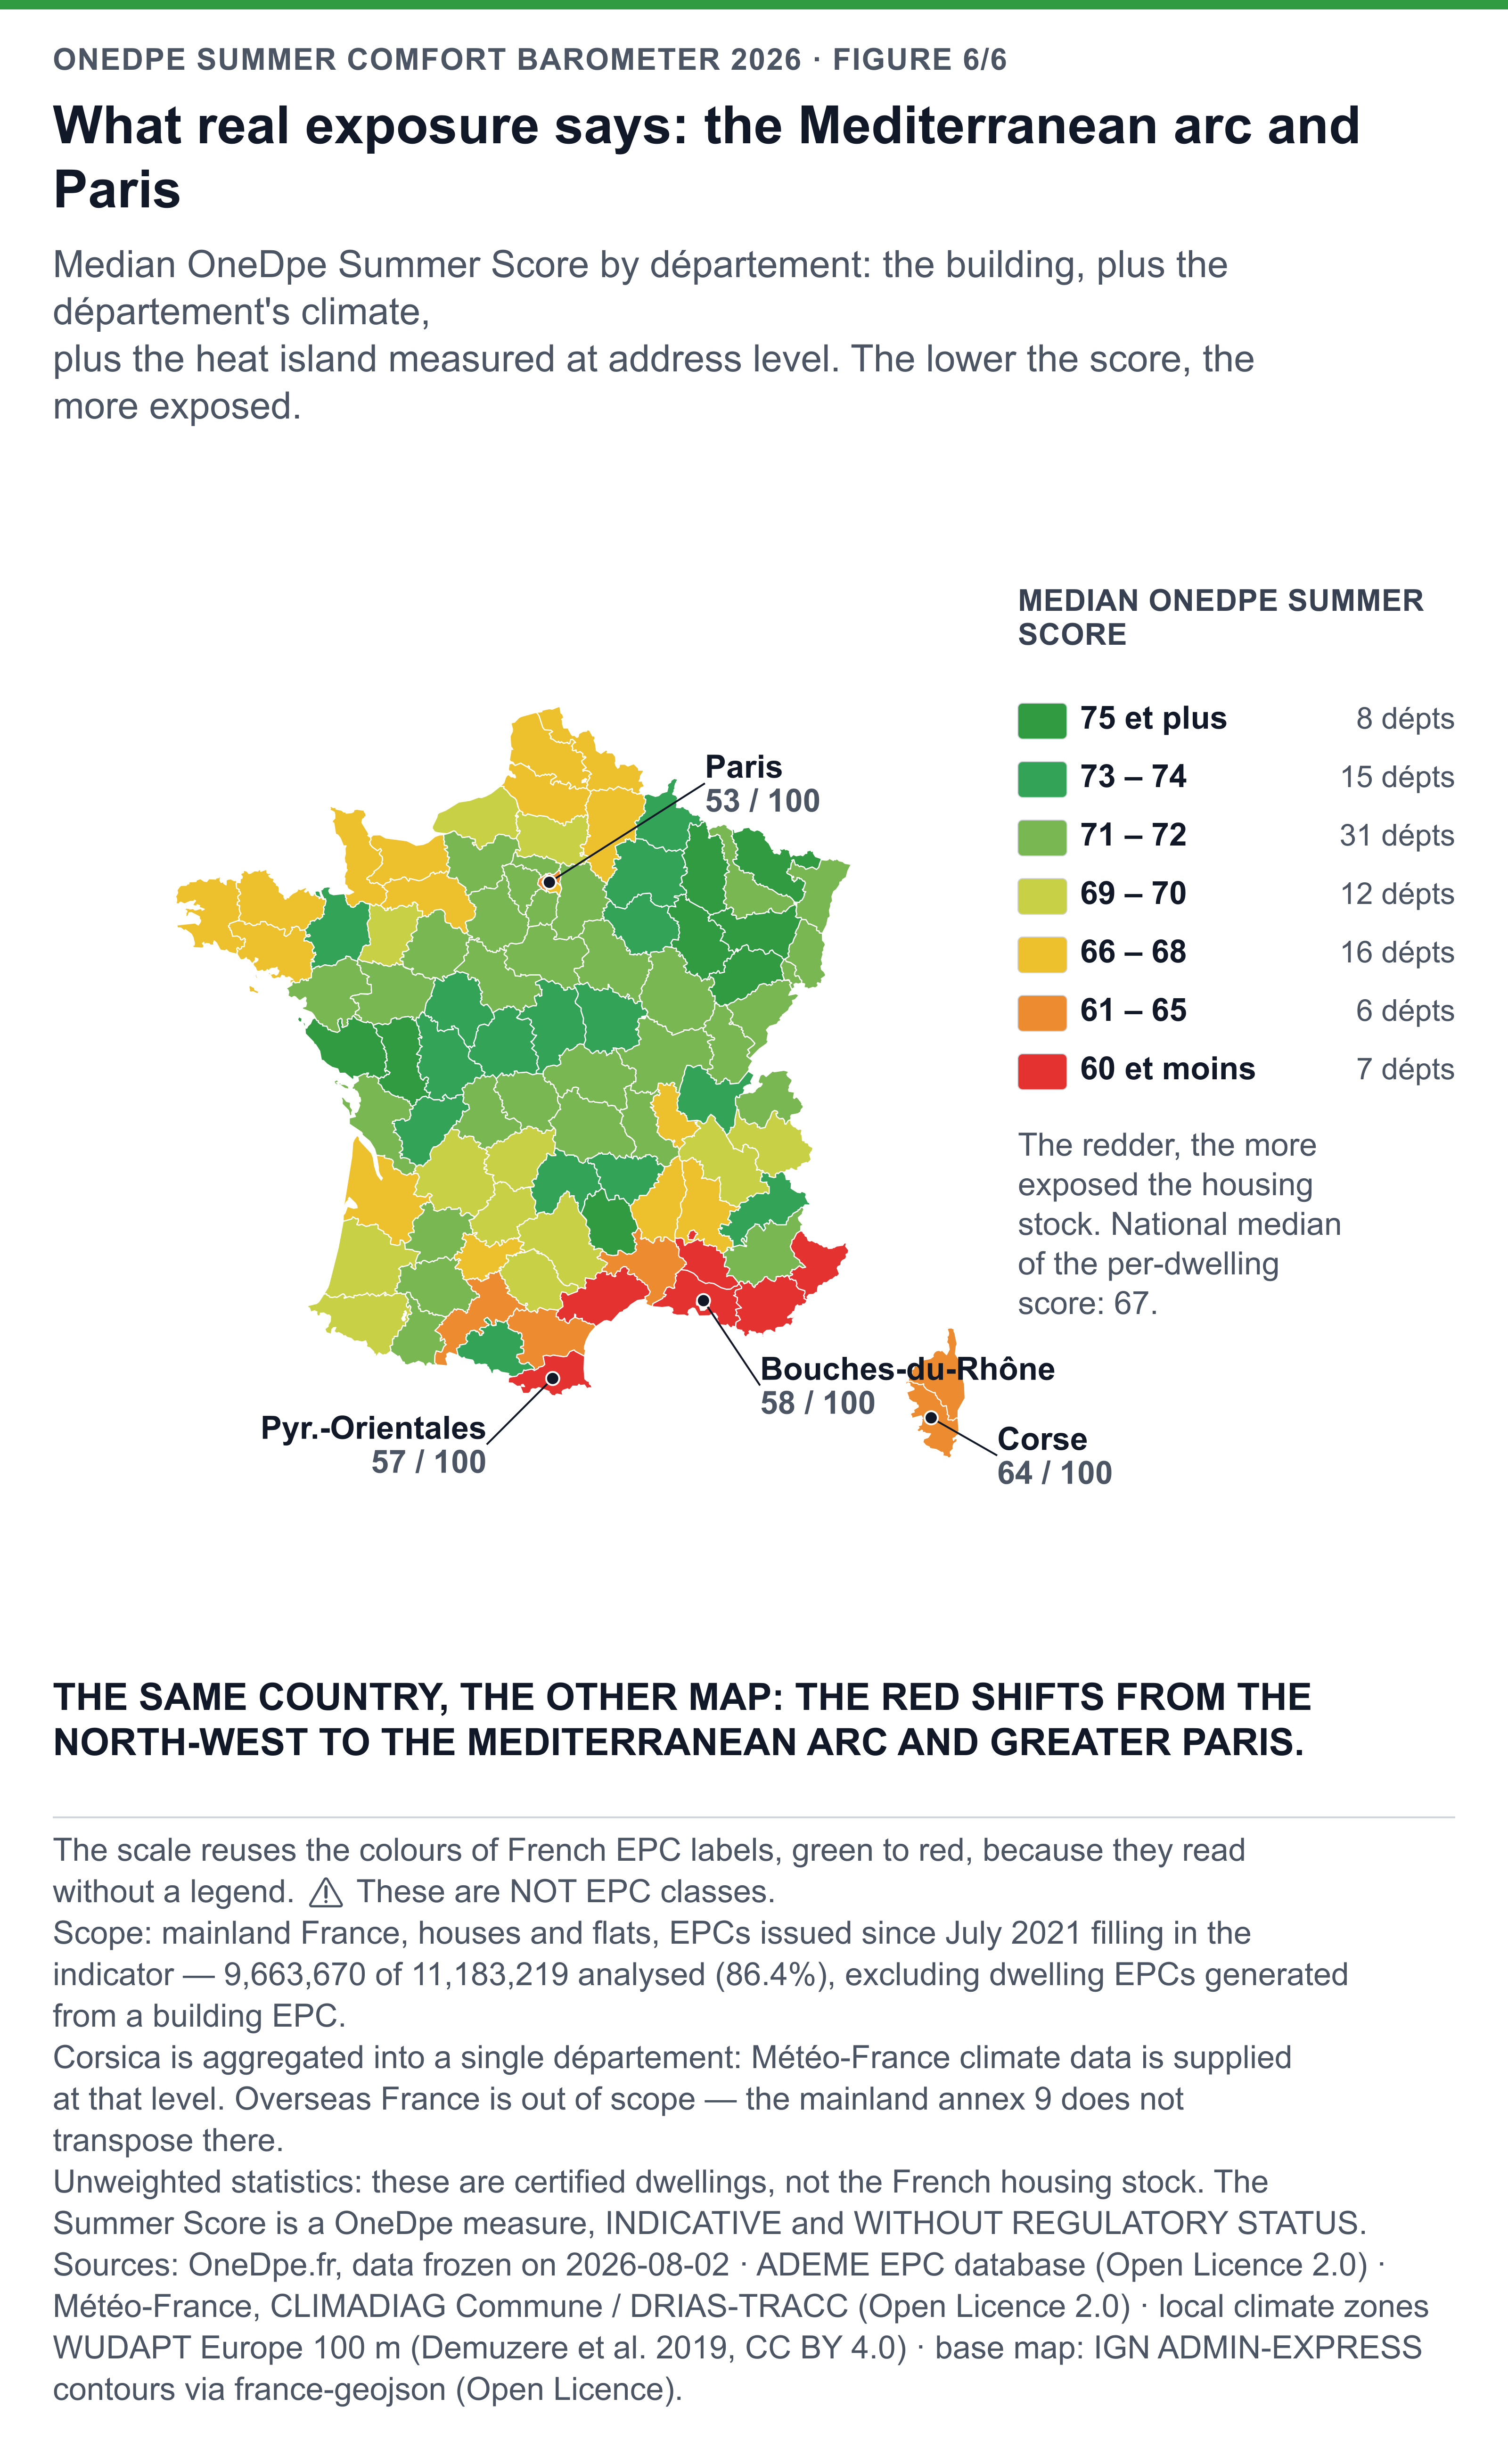
Both maps reuse the colours of French EPC labels because they read without a legend: these are not EPC classes. Click a map to enlarge and download it (high-resolution PNG or editable SVG). Base map: IGN ADMIN-EXPRESS contours, Open Licence; Corsica is aggregated into a single département, the level at which Météo-France supplies the climate data.
Map 1 — the declared indicator: the Hauts-de-France on top
At the top of the ranking by share of "insufficient" homes, the North clearly dominates — Roubaix, Hazebrouck, Tourcoing, Armentières. Nine of the ten leading towns are in the Nord and Pas-de-Calais; Paris, 5th, is the only exception — and the only one that also appears at the top of the next map.
| City | "Insufficient" homes | Summer Score (median) |
|---|---|---|
| Roubaix | 68.2% | 64 |
| Hazebrouck | 61.8% | 67 |
| Tourcoing | 61.7% | 67 |
| Armentières | 59.7% | 67 |
| Paris | 59.6% | 53 |
The explanation is architectural: these cities concentrate an old, dense, poorly shaded stock (workers' terraces, brick buildings with no solar shading and no cross-ventilation). But look at the last column: their Summer Score stays close to the national median (64 to 67). Why? Because the northern climate buffers everything: however poorly designed, a Roubaix home faces few heatwaves.
Map 2 — the Summer Score: the Mediterranean arc and Paris
For a panel of major cities, the median Summer Score tips this time towards the South and Paris. The strictly lowest scores belong to smaller towns (Agde, Apt, Roquebrune-sur-Argens) or Paris-region housing estates.
| City | Summer Score (median) | "Insufficient" homes (declared) |
|---|---|---|
| Aix-en-Provence | 52 | 33.5% |
| Paris | 53 | 59.6% |
| Perpignan | 54 | 27.0% |
| Nice | 58 | 24.2% |
| Montpellier | 58 | 24.7% |
Here it is no longer the building that decides, but the climate. The Mediterranean rim piles up long, intense summers; even a well-designed home is exposed there. Because the Summer Score is an integer, ties are frequent: Nice and Montpellier share exactly the same score (58) with twelve other towns, which occupy ranks 15 to 28 as a block.
The great gap: well-rated, badly exposed
The starkest contrast comes from the French Riviera. Take Mandelieu-la-Napoule: only 21.4% of "insufficient" homes under the official indicator — an excellent score, which places it 416th out of the 426 towns ranked. Once climate and urban heat are factored in, it climbs to 20th among the most exposed. The same shift hits Antibes, Nice and Menton.
| City | "Insufficient" (declared) | Summer Score | Reading |
|---|---|---|---|
| Nice | 24.2% | 58 | Well built, strongly exposed |
| Montpellier | 24.7% | 58 | Well built, strongly exposed |
| Antibes | 22.3% | 58 | Well built, strongly exposed |
| Paris | 59.6% | 53 | Badly built AND exposed |
Paris is the only case that tops both rankings: dense, old stock (59.6% "insufficient") and a powerful urban heat island. It is the city where the official indicator and the real risk converge.
The four reading errors to avoid
Error 1 — Believing the official indicator measures overheating risk
It measures the quality of the building against heat, not the final risk. A "good" indicator in a city that hits 38°C seven days a year does not protect you like the same "good" indicator in Brittany. Real risk = building × climate × urban environment.
Error 2 — Feeling reassured by an "average" or "good" in a hot area
This is the trap of southern cities. In Nice or Montpellier, most homes are "average" or "good" — but the climate does the rest. If you are buying on the Mediterranean rim, a decent indicator is no reason to skip checking the actual solar shading and ventilation.
Error 3 — Confusing "hot city" with "poorly adapted home"
This barometer does not say that Nice is "hotter" than Lille on the thermometer — that goes without saying. It says that the Nice housing stock, though better designed on average, remains more exposed to discomfort risk, because the climate weighs more than build quality. The nuance is essential: we are talking about how well homes are adapted, not about the weather.
Error 4 — Forgetting the floor and the urban heat island
Two homes on the same street can carry very different risks: a top floor under an uninsulated roof, in a mineral urban core, overheats far more than a ground floor on a leafy courtyard. The official indicator ignores this; the Summer Score, measured at the address, captures it.
What to check on your EPC: the summer comfort page of your certificate shows the indicator (insufficient, average or good) and the detail of the five criteria. Spot the ones that are missing — no solar shading, not dual-aspect, no ceiling fan — then cross them with your location. An "average" home on the Mediterranean rim deserves more attention than an "average" one in Brittany: for the same building, the climate makes the difference.
Where does your home stand?
Your home's Summer Score — OneDpe
From your EPC number or its address, the OneDpe summer comfort tool computes a 0-100 Summer Score that crosses the five building criteria, your town's local climate and the urban heat at your address — then places you against the national stock and details every weak point.
Going further: check the consistency of your EPC and cost your summer comfort works (solar shading, roof insulation, ceiling fans).
Conclusion
Summer comfort is the next big frontier of home surveying, and this barometer shows why it is tricky: the official indicator, useful as it is, tells only half the story. Looking at the building alone, it points to the North; adding climate and the city, the risk tips towards the South and Paris. For a buyer, a seller or a landlord, the takeaway is concrete: do not trust the single word "insufficient" or "good" — look at where the home is.
The OneDpe Summer Score was built precisely for this: to turn a three-level indicator, blind to location, into a rating that factors in your climate and your address. That is the difference between knowing a home is poorly shaded and knowing it will actually overheat.
To go further: the current indicator and the reform expected for 2028, what is known about the "summer comfort letter" and our 2026 DPE reliability barometer.