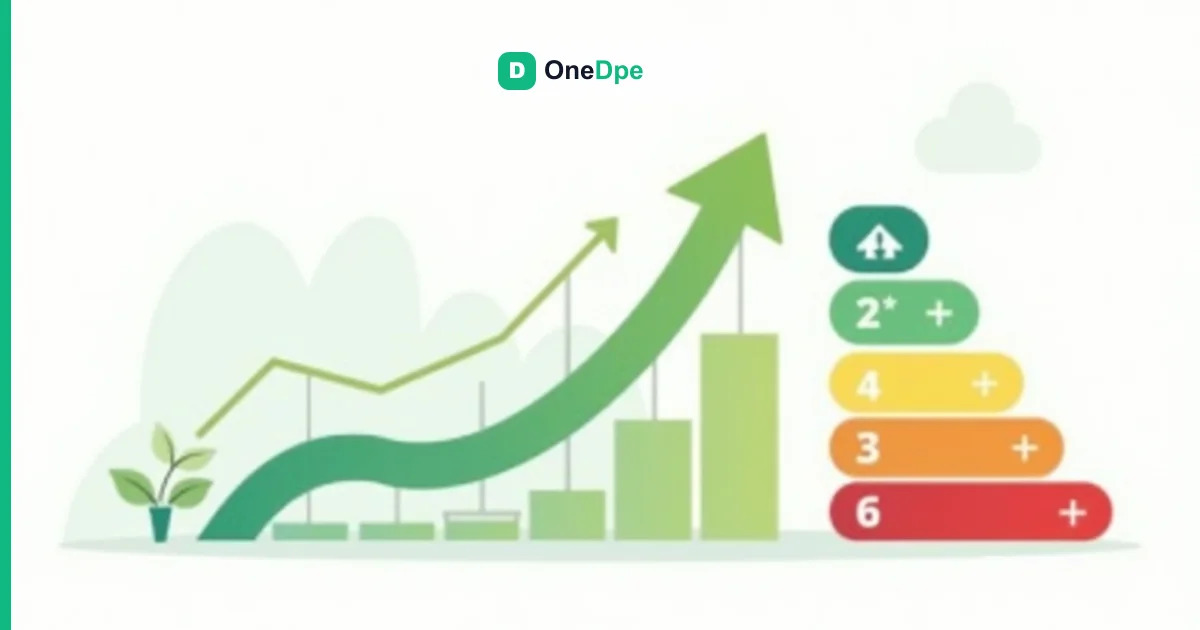
You insulated the attic, replaced the boiler, fitted double glazing. On paper, the quote promised 40% savings on your bills. A year later, you look at your meter readings: the real drop is closer to 20-25%. You did not cheat, nor did you pick the wrong tradespeople. You have just met the rebound effect — the phenomenon by which part of the energy savings expected after a renovation "dissolves" into a more comfortable use of the home.
This gap is not marginal, and it is nothing to be ashamed of: it is documented by public statistics, which now cross-reference energy certificates with the real consumption measured by smart meters. Understanding it avoids two traps: feeling cheated by a quote that "lied", and overestimating the profitability of works you are about to commit to.
20 to 30% of a renovation's theoretical energy savings evaporate on average, owing to the rebound effect and the gap between conventional and real consumption (ADEME orders of magnitude / statistical work on consumption data). In other words: a promise of 40% often translates into 25-30% actually seen on the bill.
What this article covers
What the rebound effect actually covers after an energy renovation, why the measured real savings (smart-meter data, SDES studies) fall short of the theoretical gains, how the EPC's conventional consumption differs from your real consumption, and five concrete levers to limit the rebound effect — without giving up the works or being oversold on savings.
The rebound effect: a documented phenomenon, not an anomaly
The rebound effect describes the share of energy savings expected from a technical improvement that ends up offset by a change in behaviour. Applied to housing: after a renovation that makes heating cheaper per degree, the occupant tends to heat a little more — for longer, in more rooms, at a higher temperature. Part of the technical gain therefore goes into extra comfort rather than a lower bill.
The phenomenon has long been studied by ADEME (the French Environment and Energy Management Agency) and by energy economists. It is neither a flaw of the renovation nor a fraud: it is a human and rational reaction. When a service becomes cheaper, people consume more of it — true of heating as it is of low-energy lighting or transport.
What has changed recently is the ability to measure it at scale. With the rollout of smart meters (Linky for electricity, Gazpar for gas), it has become possible to compare the real consumption of renovated homes with that predicted by certificates. The SDES (the statistical data and studies service of France's Ministry for the Ecological Transition) and several public statistical studies have thus confirmed a structural gap between theory and reality.
Depending on the sources and methodologies, this gap is estimated within a wide range — of the order of 30 to 50% between the theoretical energy savings of a measure and the savings actually observed, with the "direct" rebound effect (the return of comfort) explaining a major part. These figures remain orders of magnitude: they vary strongly with the type of home, the scope of the works and the occupants' starting situation.
⚠️ Key takeaway: the rebound effect reduces savings, it does not cancel them. A serious renovation remains a clear winner on the bill, on comfort and on the value of the home. The trap is not to renovate — it is to build a financing plan on the maximum theoretical savings.
The framework: EPC, conventional consumption and real consumption
To understand why the gap is normal, you must distinguish two quantities that are often confused.
The EPC's conventional consumption
Since its reform, the EPC (the French DPE — Diagnostic de Performance Énergétique — Energy Performance Certificate) relies on the 3CL-DPE method (the regulatory calculation method, ministerial order of 31 March 2021, amended on 25 March 2024). This method computes a so-called conventional consumption: it assumes a standardised use of the home — a fixed set-point temperature (around 19°C on average across the rooms), a typical occupancy, normalised hot-water and ventilation scenarios. The EPC therefore does not measure what you consume: it estimates what an "average" household would consume in this home, under conventional conditions.
This is a deliberate methodological choice: for a label to be comparable from one home to another and reproducible from one assessor to another, individual behaviours must be neutralised. A heavy user and a frugal one must obtain the same label for the same property. The trade-off: the label does not predict your real bill, which depends on your usage.
To explore this calculation on your own home, see the OneDpe 3CL EPC simulator, which applies the official conventional method.
Real consumption, measured at the meter
Real consumption, for its part, depends on everything the convention neutralises: the temperature you choose, the number of heated rooms, hours of presence, the number of occupants, habits. This is what Linky and Gazpar measure, and it is what appears on your bill.
Statistical work cross-referencing the EPC with real consumption shows two converging things. First, in very energy-hungry homes, real consumption is often lower than conventional consumption: occupants, for lack of means, under-heat (the energy-poverty phenomenon). Second, in very efficient homes, real consumption is sometimes higher than conventional: people enjoy the comfort. This "regression to the mean" of consumption is precisely what feeds the rebound effect after renovation.
| Concept | What it measures | Source / framework |
|---|---|---|
| Conventional consumption (EPC) | Standardised, comparable, reproducible use | 3CL-DPE method — ministerial order of 31 March 2021 (amended 25 March 2024) |
| Real consumption | Your actual use (temperature, presence, habits) | Smart meters (Linky, Gazpar) |
| Rebound effect | Share of savings absorbed by increased comfort | ADEME / SDES work on consumption data |
The direct consequence: comparing the drop in EPC label with the drop in your bill amounts to comparing two different quantities. Moving from F to C may show conventional consumption halved or cut by three without your bill following the same proportions — especially if you heated little beforehand.
Why your real savings fall short of the forecast
Three mechanisms combine to widen the gap between the quote's promise and the reality of the bill.
1. The return to normal comfort (direct rebound effect)
This is the main driver, especially in thermal sieves. Before the works, many households heat below comfort level: closed-off rooms, thermostat turned down, heating off at night, out of budget constraint. According to public data, a substantial share of households report suffering from the cold for lack of being able to heat properly (energy-poverty indicators tracked by France's energy-poverty observatory and the SDES). After renovation, heating becomes affordable: people finally heat every room, to 20 or 21°C, evening and night alike. The comfort gained is real and legitimate — but it consumes part of the theoretical saving.
Profile: an F-rated house occupied by a retired couple who lived in two rooms heated to 18°C. After insulation and a heating upgrade, they heat the whole house to 20°C. Their EPC gains several grades, their comfort is transformed — but their bill falls less than the theoretical percentage, because they now heat a far greater volume.
2. The conventional / real gap
Even with no change in behaviour, the gap exists by construction (see the previous section). The theoretical gain of a measure is calculated on the basis of conventional consumption before and after; if your real starting consumption was already lower than the conventional one, the gain in euros on your bill will mechanically be smaller than the headline percentage.
3. Other uses and indirect effects
The saving freed up on heating can be partly redirected to other consumption: a more comfortable home is more lived-in, equipment is added, more time is spent there. This is the indirect rebound effect. It is more diffuse and harder to quantify, but it contributes to the overall drop in the energy bill being smaller than the drop in the heating item alone.
⚠️ Beware the "lying quote" trap: a quote showing 40% savings is not dishonest if it rests on conventional gains. The misunderstanding comes from the reading: that percentage describes the drop in theoretical consumption, not a guaranteed drop in your bill. Always ask on what basis the figure is calculated.
Case study: renovating an F-rated house (illustrative figures)
Take an illustrative case (the amounts below are orders of magnitude, for guidance only, not the result of an engine calculation): a detached house of around 100 m² rated F, heated by gas, whose real energy bill is around €2,500 a year. The project — attic and wall insulation, boiler replacement, ventilation — aims for a jump of several grades and shows, on the quote, around 45% savings on conventional consumption.
Scenario — theoretical vs real (illustrative, for guidance only)
| Item | Reading | Indicative amount |
|---|---|---|
| Energy bill before works | Real consumption observed | ~€2,500/yr |
| Headline theoretical saving | −45% on conventional consumption | ~ −€1,125/yr |
| "Theoretical" bill after works | If the bill followed the percentage | ~€1,375/yr |
| Rebound effect + conventional/real gap | Increased comfort + starting base | ~ +€375 to +€500/yr added back |
| Real bill after works (estimated) | Real saving ≈ 25-30% | ~€1,750 to €1,875/yr |
Reading the table: the saving actually observed (of the order of 25 to 30%) remains substantial — several hundred euros a year — but it is clearly below the 45% on the quote. The difference has not disappeared: part of it has become comfort (every room heated, at the right temperature), which has its own value. These figures are deliberately presented as a range: the real outcome depends on your starting situation, the quality of the installation and your habits.
The saving stays real. Over ten years, even at a 25-30% drop, the cumulative total runs into thousands of euros — on top of the increase in the property's value (green value) and eligibility to let for homes that leave thermal-sieve status.
How to limit the rebound effect without giving up the works
The goal is not to heat less to "make it pay" — you have every right to be warm. It is about not losing the saving by mistake and planning your works on realistic assumptions. Five concrete levers.
What to do to limit the rebound effect:
1. Reason on a prudent range, not on the maximum
To build your financing plan, use the low end of the savings (for instance 60 to 70% of the headline theoretical gain). If reality does better, it is a bonus. Building a loan or a return-on-investment calculation on the maximum saving exposes you to disappointment and a tight budget.
2. Manage temperature and controls
The rebound effect plays out largely on the heating set-point. A programmable thermostat, thermostatic radiator valves, room-by-room control and a managed set-point (around 19-20°C in living rooms, less in bedrooms) let you enjoy the regained comfort without drifting into overconsumption. It is often the most profitable complementary investment after insulation.
3. Combine insulation and system, in the right order
An efficient heating system installed in a poorly insulated home sees its real efficiency degraded: you heat a "sieve" more efficiently, but you still heat a lot. Treating the envelope (insulation) before or at the same time as the system maximises the real gain. The order of the measures is decisive: see our analyses on the 5 best-ROI works to gain one EPC grade and on the compared cost of a heat pump, a boiler and a heat network.
4. Track your real consumption after the works
Smart meters give access to your consumption curves. Comparing equivalent months before and after (at comparable climate severity) lets you measure the real saving and detect any drift in the set-point. This tracking is the best antidote to the unintended rebound effect.
5. Value the comfort, do not mistake it for a loss
Part of your "missing saving" is in fact comfort you did not have before: rooms finally warm, the end of damp, better air quality, preserved health. That gain does not show on the bill but it is very real. Mentally accounting for it avoids judging the renovation by the yardstick of saved euros alone.
Cost your works on realistic assumptions
Simulate my renovation and realistic savings
The OneDpe renovation simulator estimates the EPC grade jump, the cost of the works, the grants available (MaPrimeRénov', Energy Saving Certificates, eco-zero-rate loan) and the priority order of the measures. It helps you reason on a prudent range rather than on the maximum theoretical saving — for a financing plan that holds up against the rebound effect.
To go further: the 5 best-ROI works and heat pump vs boiler vs heat network.
Conclusion
The rebound effect explains why a renovation's real savings are, on average, 20 to 30% below the theoretical gains: part of the technical progress turns into comfort, and the EPC measures a conventional consumption, not your bill. This is neither a diagnostic error nor a misleading quote — it is a statistical fact now measured on meter data. The right response is not to give up the works, but to cost them on prudent assumptions and to manage your consumption.
Before committing a budget, it is therefore wiser to frame the project on a realistic saving. The OneDpe renovation simulator lets you estimate the EPC gain, the cost, the grants and the order of the measures — bearing in mind that the low end of the range is the safest basis for a decision.