An energy sieve does not sell for the same price everywhere. In Tulle or Thiers, an F- or G-rated house sells on average nearly 40% less per square metre than a C- or D-rated house in the same area. In the inner Paris suburbs or on the French Riviera, the gap almost disappears. To find out, we analysed nearly a million real sales for which both the price and the energy label are known — and drew from them a discount, city by city and department by department.
The exact term is "observed discount": a price gap measured on real transactions, not the isolated effect of the label. That nuance matters, and we come back to it in detail. But the overall picture is clear-cut — and, for houses, it matches the "green value" measured by the Notaires de France using a completely different method.
Across nearly 956,000 home sales analysed (real prices cross-checked with the EPC label), an F- or G-rated house sells on average 18% less per m² than a D-rated house — up to −22% for class G alone. But that national average hides gaps of one to four depending on the town.
What this article covers
The national discount figure for energy sieves on houses and how it compares with the Notaires' green value, the department map showing where the penalty is strongest (and where it vanishes), the ranking of towns where energy sieves discount the most, why we do not publish a ranking for flats (an instructive methodological trap), the method and its limits stated plainly, and how to estimate the discount on your own home.
How much less is an energy sieve worth? The national figure (houses)
Across all houses sold, the price per square metre falls steadily as the label worsens. Taking class D as the reference (the median label of the housing stock), we observe:
| EPC class | Price gap per m² vs class D (houses) | Reading |
|---|---|---|
| A | +26% | Strong premium (but inflated by how recent the stock is — see below) |
| B | +18% | Clear premium |
| C | +10% | Moderate premium |
| D | reference (0%) | Pivot label |
| E | −7% | Discount appears |
| F | −16% | Energy sieve — banned from rental in 2028 |
| G | −22% | Energy sieve — already banned from rental since 2025 |
The curve is clear: every notch of the label is paid for. And, crucially, it converges with the market's independent benchmark — the "green value" study by the Notaires de France, which measures the same phenomenon through hedonic regression (a method that statistically isolates the effect of the label by neutralising the property's other characteristics).
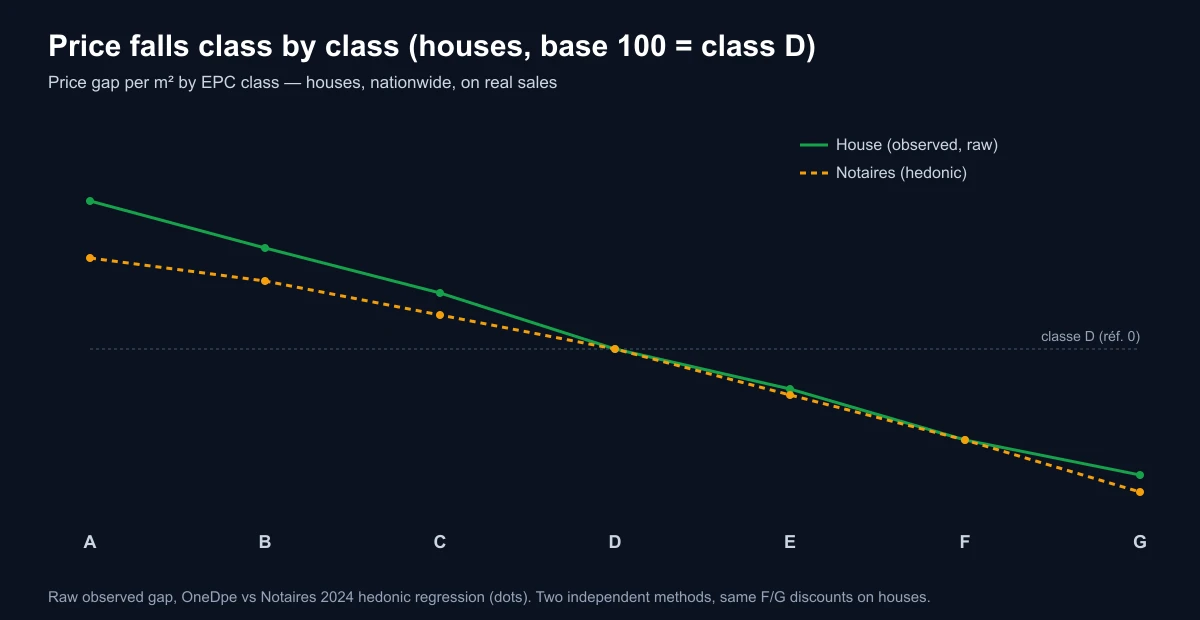
On energy sieves, the two methods agree: −16% for F (identical to the Notaires figure) and −22% for G versus −25% for the Notaires. The residual gap on G is logical: our figure is raw (it blends the label's effect with other differences), whereas the Notaires' is corrected. When two such different approaches — one on nearly all matched sales, the other on a statistical model — converge to within 3 points, the discount on energy-sieve houses is a solid fact, not an artefact.
One caveat on the top of the table: the premium for classes A and B (+26%, +18%) is overstated by our method, because an A- or B-rated house is often recent — and new build sells for more per m² regardless of energy. That is exactly what hedonic regression corrects (the Notaires put the A premium at +16%). So we emphasise the discount on energy sieves, where the two methods agree, rather than the premium on good labels.
In euros, the order of magnitude is tangible. On a 100 m² house at the median reference price (around €2,100/m² nationally, i.e. close to €210,000), a G label represents a gap of roughly €45,000 — and far more where the local discount exceeds 30%. That is the amount funded, on one side, by the seller who did not renovate; on the other, by the buyer who will have to carry out the works to be able, tomorrow, to re-let or resell the home.
The discount is not the same everywhere
The national average hides the key point: the energy-sieve discount is first and foremost a matter of geography. Where the market is slack — rural areas, declining mid-sized towns — an energy sieve becomes very hard to sell, and the discount soars. Where the market is tight — metro areas, sought-after coastline, the Paris ring — the scarcity of land outweighs the label, and the penalty fades.
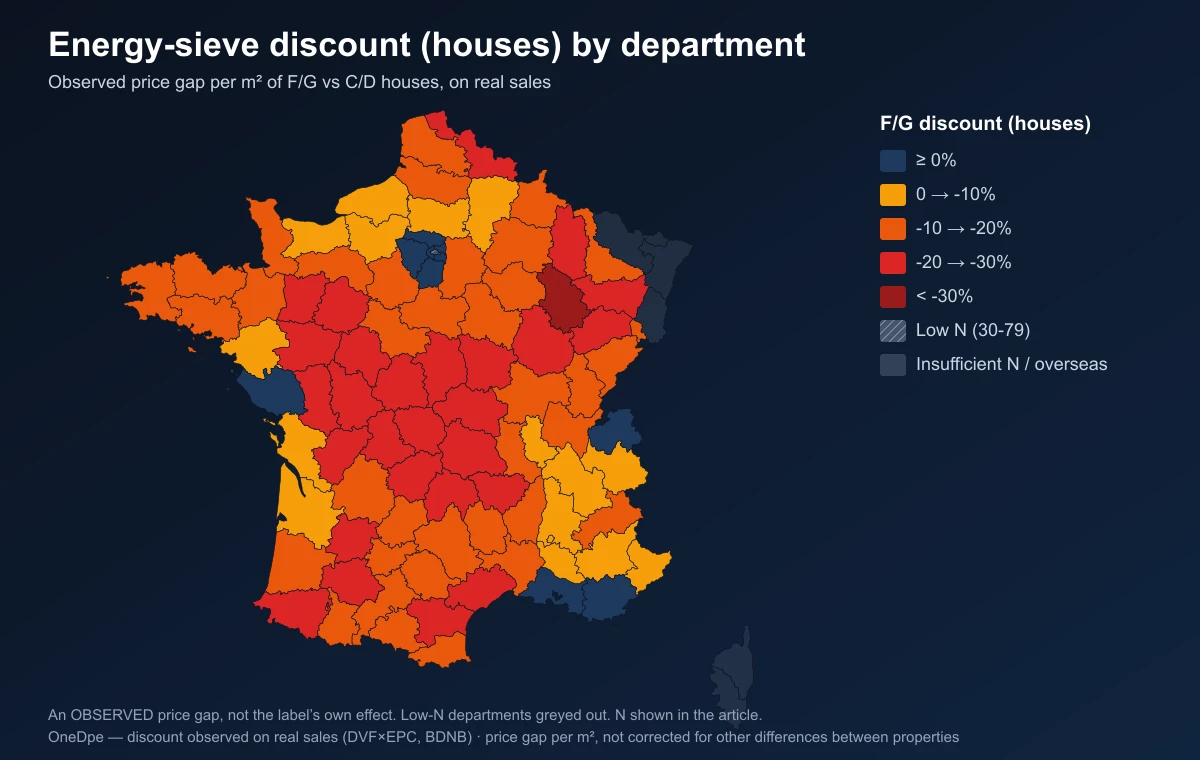
The contrast is striking. In the Haute-Marne, F/G houses sell 36% less per m² than C/D ones; in the Vienne, the Deux-Sèvres, the Sarthe or the Limousin, the discount exceeds 28%. At the opposite end, in the departments of the inner Paris suburbs (92, 93, 94), in Haute-Savoie, in the Bouches-du-Rhône or the Var, the observed gap is nil or even clearly positive (up to +12% in the Val-de-Marne) — not because an energy sieve would be an asset there, but because the few energy-hungry houses are so well located that their price per m² does not fall.
This geography has a direct consequence for anyone buying, selling or renting: the same G label does not carry the same financial weight depending on the town. And it matches what market common sense suggests — in a tight market, you buy a location first; in a slack market, the cost of works and the difficulty of reselling an energy sieve weigh fully in the negotiation.
The ranking of towns where energy sieves discount the most
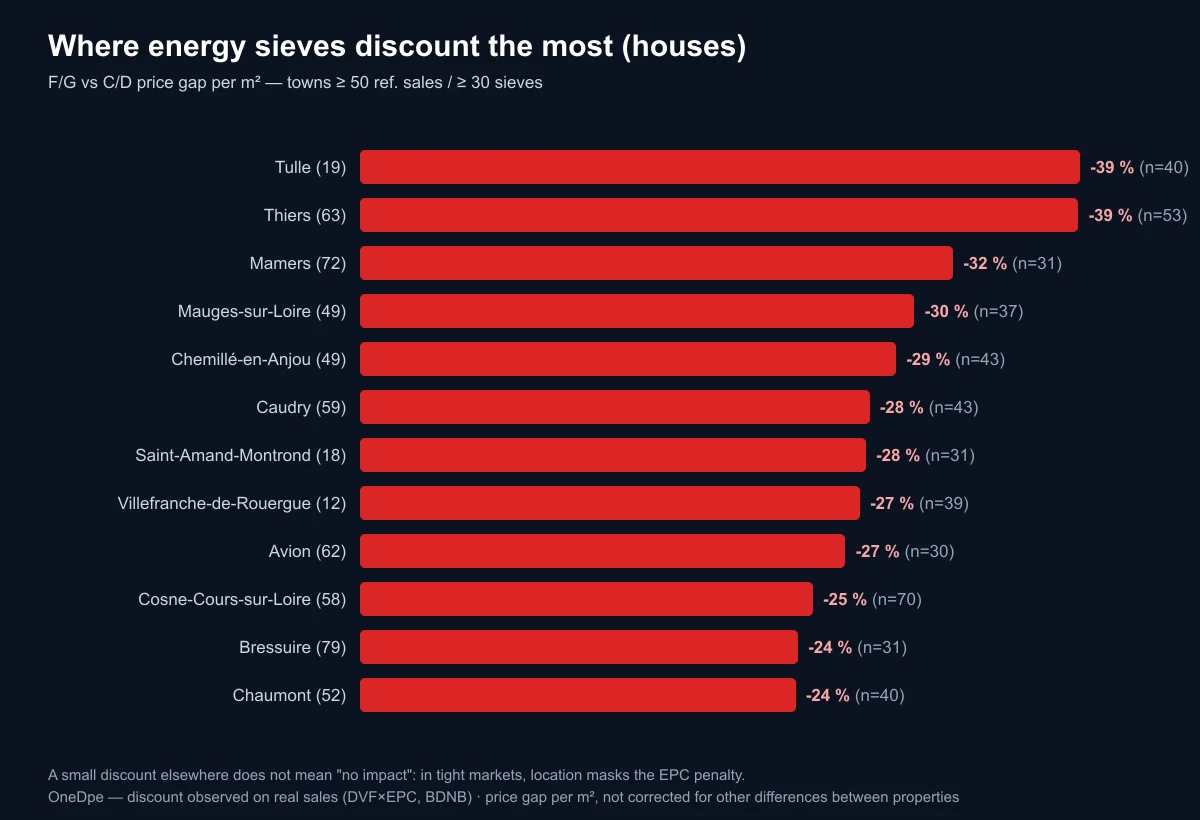
Keeping only towns with a sample large enough to be robust (at least 50 reference sales and 30 energy-sieve sales), here are those where the price gap per m² between energy sieves and decent homes is widest — for houses only.
| Town (department) | F/G house discount vs C/D | Energy-sieve sales |
|---|---|---|
| Tulle (19) | −39% | 40 |
| Thiers (63) | −39% | 53 |
| Mamers (72) | −32% | 31 |
| Mauges-sur-Loire (49) | −30% | 37 |
| Chemillé-en-Anjou (49) | −29% | 43 |
| Caudry (59) | −28% | 43 |
| Saint-Amand-Montrond (18) | −28% | 31 |
| Villefranche-de-Rouergue (12) | −27% | 39 |
The profile is unmistakable: small and mid-sized towns of the French interior, with modest prices per m² (often €1,000 to €1,500/m²), where the supply of housing outstrips demand. In these markets, an energy sieve combines two handicaps — a heavy renovation cost and an uncertain resale — that the buyer passes on in full to the price. Conversely, a small discount elsewhere does not mean "no impact": in a tight market, location masks the penalty, but the regulatory risk (rental ban) remains in full.
Why we do not publish a ranking for flats
This is the most important methodological lesson of this study — and the most counter-intuitive. The raw price-per-m² method, reliable on houses, breaks down completely on flats. In our sub-sample, F/G flats in the provinces show a gap that is… slightly positive (+6%), and at the raw national level the gap climbs to +42%. Read literally, that would mean an energy-sieve flat sells for more — which is obviously absurd.
The explanation: a location effect, not a premium on energy sieves. Energy-hungry flats concentrate in old, dense town centres — often the most expensive areas per square metre. Conversely, many well-rated flats are recent peripheral builds, cheaper per m². The raw comparison therefore mixes the label's effect with a powerful location effect that flips the sign. This is exactly the bias that the Notaires' hedonic regression neutralises — and it is why, for flats, one must rely on their corrected measure (around −12% for a G-rated flat) rather than on a misleading raw gap.
Paris proves the point: in the capital, where the market is extremely tight and the stock homogeneous (Haussmannian), our data show a discount on G-rated flats of just −3%. That is consistent — in a market where every square metre is fought over, the label barely affects the asking price, even though the regulatory risk remains. So we publish rankings for houses only, a more homogeneous stock where the method holds, and defer to the Notaires' green value for flats.
How to read — and use — these figures
Our discount is computed as follows: for each town or department, we compare the median price per m² of energy sieves (F+G) with that of reference homes (class D), using the real sales published in the DVF database, matched to the EPC label via France's National Building Database (BDNB). We keep only single-dwelling sales (to exclude bulk lots) and discard aberrant geometries.
The limits, stated plainly. This gap is observed, not corrected: it blends the label's own effect with other differences between properties (precise location, age, general condition). It is not a controlled hedonic regression like the Notaires'— which is why we use it as their geographic complement, and systematically compare our figures with theirs. The results cover the observable sub-sample (matched price×label sales), not the whole market. Low-sample towns and departments are excluded or greyed out. In total, 452 towns clear our robustness threshold to appear in the ranking; a larger dataset (2,560 towns) exists, but with estimates smoothed toward the department average where the local sample is thin.
The practical use? If you are buying an energy sieve, this discount is your legitimate negotiating margin — and a reminder that works will have to be funded to resell or let it. If you are selling, it tells you what to expect in your area. If you are a landlord, it quantifies the stakes of the rental-ban calendar (G since 2025, F in 2028, E in 2034).
This discount is, moreover, likely to widen in slack markets. As the rental-ban calendar approaches — class F will join class G among homes banned from rental in 2028 — demand for energy sieves narrows to buyers willing to renovate. Where resale is already difficult, the label becomes a first-order price driver, ahead of charm or floor area. Conversely, in a tight market, a buyer may still bet on location; but they then take on a regulatory risk that the purchase price has not discounted.
Estimate your home's EPC discount
Our discount simulator computes the impact of the label on your property's value, by type, class and location — calibrated on the Notaires' green value and cross-checked against real sales. It also quantifies the value recovered after works and the grants available.
To first check that your certificate is reliable: the OneDpe EPC check.
Conclusion
The energy-sieve discount is neither a myth nor a single number: it is a measurable market reality that varies from one to four depending on the location. On houses, nearly a million sales confirm it and match the Notaires' green value: −16% for F, −22% for G, and up to −40% in slack-market towns. On flats, caution is required — the location effect blurs the raw reading, and only the corrected measure stands.
The right reflex, before buying, selling or letting: compare the label with the local market and the cost of works. The OneDpe EPC discount quantifies it for your property, and the EPC check first makes sure the label is reliable.