The energy performance certificate — in France, the DPE (Diagnostic de Performance Énergétique), the local equivalent of an EPC — has become a high-stakes document: it triggers the rental ban on energy-inefficient homes (French Construction and Housing Code, art. L.173-1-1), unlocks the MaPrimeRénov' renovation grant, and measurably affects sale prices. But how good is the certificate in your hands? To find out, we ran 689,279 EPCs from the open ADEME database through the very same consistency engine that powers our verification tool.
The result: roughly 1 EPC in 9 carries at least one major inconsistency — an anomaly strong enough to cast doubt on the displayed class or the declared consumption. This barometer proves no fraud: it measures atypical signatures, i.e. statistical gaps between what the certificate shows and what the building's physics or regulatory thresholds would lead one to expect.
11.1% of analysed EPCs carry at least one major inconsistency — and that rate climbs to 14.3% for flats and 36% for stock built after 2013. The "good" labels (A, B) are not the most reliable.
What this article covers
We first explain what this barometer measures — and what it does not. Then we present the findings: the national inconsistency rate, its breakdown by anomaly family, by displayed label, by construction era and by dwelling type, plus a department-level map. Finally we detail the method (sample, weighting) and give a practical checklist to verify your own certificate before buying, selling or starting renovation work.
What is an EPC "inconsistency"?
An EPC rests on dozens of inputs entered by the assessor: floor areas, materials, insulation, heating type, heat losses, consumption. An inconsistency is a logical gap between those inputs — for example a declared consumption incompatible with the computed heat losses, a label that does not match the entered consumption against official thresholds, or insulation declared compliant with a regulation that did not exist at the building's construction date.
We grouped all of our engine's checks into eight measurable families, designed to avoid false positives (a check that fires on a mere missing value is excluded from the rate):
| Family | What it detects |
|---|---|
| Ubat compliance (RT/RE) | Building-envelope heat losses better than what the thermal regulation of the construction year allowed. |
| End-use breakdown | Split of consumption (heating, hot water, cooling…) that is physically improbable. |
| Consumption vs building | Declared consumption incompatible with floor area, volume or heat losses. |
| Physical impossibility | Heat losses × climate severity unrelated to consumption; aberrant ratios. |
| Geolocation | Climate zone or altitude incompatible with the address. |
| Label ≠ declared consumption | The displayed class does not match the entered consumption against official thresholds. |
| Hot water (DHW) | Domestic hot water production inconsistent with the equipment or floor area. |
| Collective signatures | Whole buildings with abnormally uniform EPCs (investigation strand). |
⚠️ An inconsistency is not fraud. A statistical anomaly can stem from a data-entry error, a default value, a genuinely atypical building, or an undocumented renovation. This barometer flags points to check, not cases to sanction.
What the barometer reveals: 1 EPC in 9 is inconsistent
Across the 689,279 certificates analysed (dwellings, 3CL-2021 methodology — the regulatory calculation method for residential EPCs), 11.1% carry at least one major inconsistency — an anomaly of critical or high severity. If moderate-severity anomalies are included, 41% of EPCs show at least one attention signal, across all families.
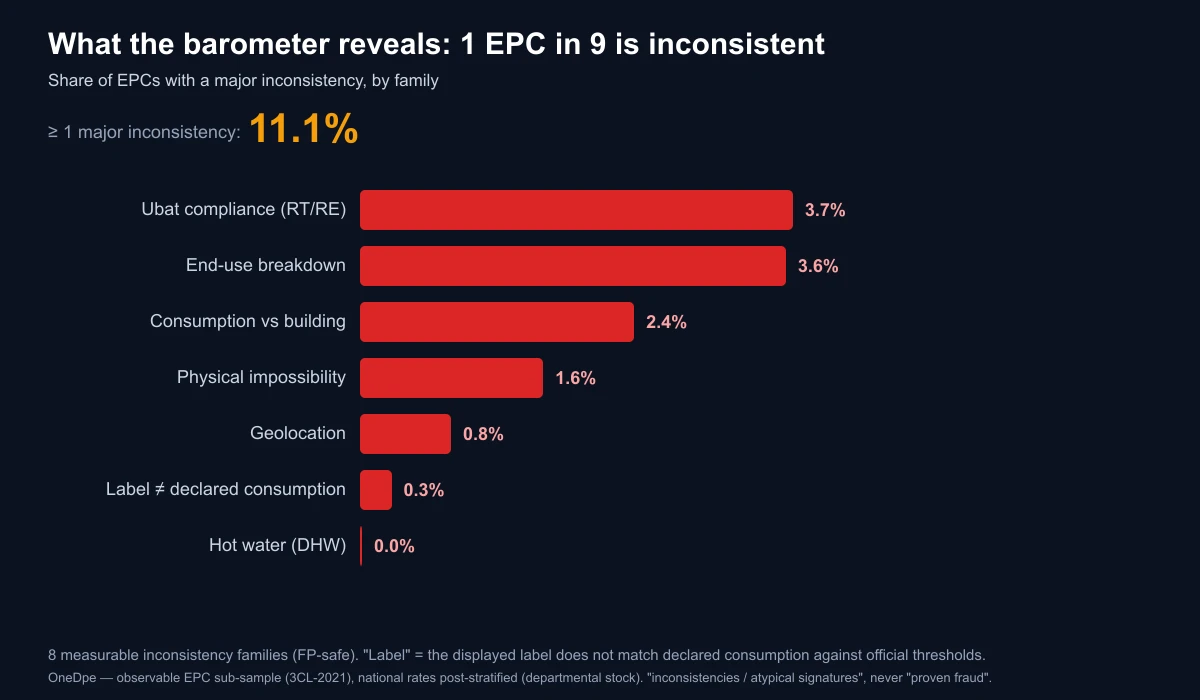
The ranking of families is instructive. The two leading causes of major inconsistency are not the ones you would expect:
| Inconsistency family | Share of EPCs (major) |
|---|---|
| Ubat compliance (RT/RE) | 3.7% |
| End-use breakdown | 3.6% |
| Consumption vs building | 2.4% |
| Physical impossibility | 1.6% |
| Geolocation | 0.8% |
| Label ≠ declared consumption | 0.3% |
| Hot water (DHW) | 0.0% (moderate-severity anomalies only) |
Contrary to popular belief, the mismatch between the displayed label and the declared consumption is rare (0.3%): assessors respect the class thresholds. Major anomalies sit elsewhere — in the building envelope (insulation declared too good for the construction year) and in the split of consumption between end-uses.
Two more technical families round out the picture, alongside the headline rate: the ratio between primary and final energy (the conversion factor applied to electricity, affecting 5.3% of the homes concerned) and mechanical ventilation. Including them, the share of EPCs carrying at least one major inconsistency rises to 16.1%.
Where do inconsistencies concentrate?
The barometer reveals three sharp fault lines: dwelling type, displayed label and — above all — construction era.
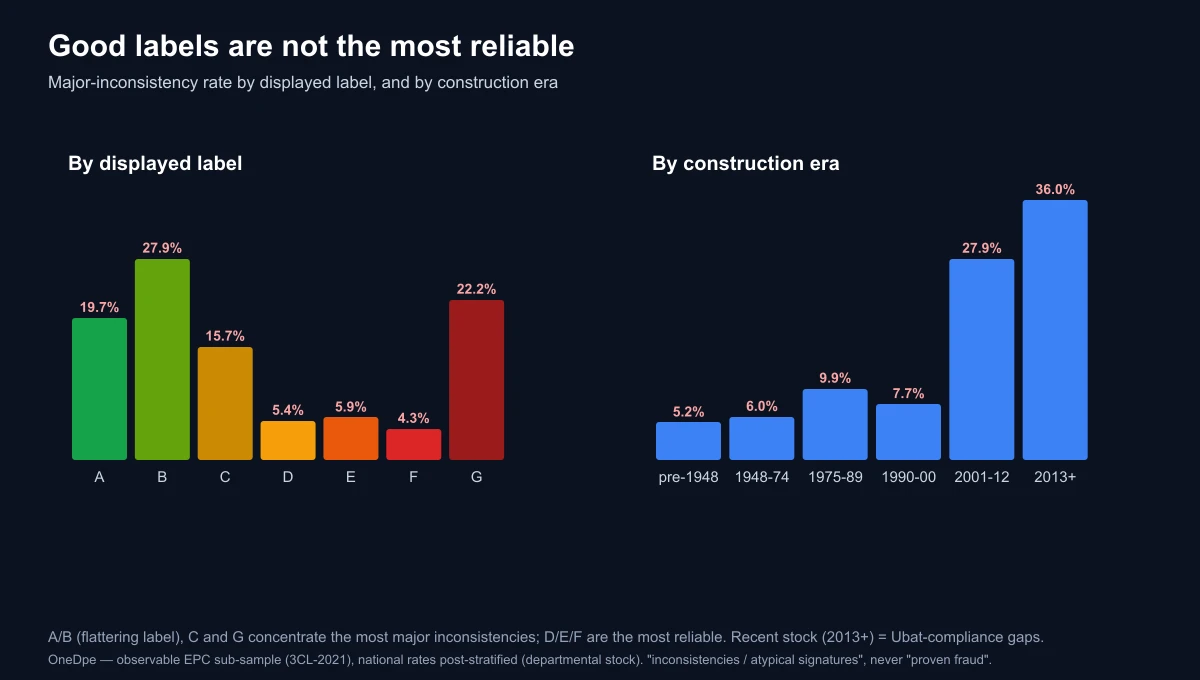
Good labels are not the most reliable
You might assume that a home labelled A or B — new and high-performing — leaves little room for error. The opposite is true. The major-inconsistency rate traces a U-shape: high at the extremes, low in the middle.
| Displayed label | Major-inconsistency rate |
|---|---|
| A | 19.7% |
| B | 27.9% |
| C | 15.7% |
| D | 5.4% |
| E | 5.9% |
| F | 4.3% |
| G | 22.2% |
Class B shows the highest rate (27.9%), followed by G (22.2%) and A (19.7%). The middle classes D, E and F are, by contrast, the most consistent (4 to 6%). The reason is physical: reaching class A or B requires a very high-performing envelope and equipment — hence values close to regulatory limits, where the slightest optimistic input flips a check. At the other end, G-rated homes often combine extreme values (very high heat losses, high consumption) prone to aberrant ratios.
Recent stock accumulates the gaps
This is the barometer's most counter-intuitive result. Far from making the certificate more reliable, recent construction undermines it:
| Construction era | Major-inconsistency rate |
|---|---|
| Before 1948 | 5.2% |
| 1948-1974 | 6.0% |
| 1975-1989 | 9.9% |
| 1990-2000 | 7.7% |
| 2001-2012 | 27.9% |
| 2013 and later | 36.0% |
A home built after 2013 is almost seven times more likely to carry a major inconsistency than one built before 1948. The cause is mainly the "Ubat compliance" family (Ubat is the average envelope heat-loss coefficient: the lower it is, the better the building is insulated): recent stock must meet demanding thermal regulations (RT 2012, RE 2020), and the engine flags cases where the entered heat losses are better than those regulations allow — a frequent gap when calculation values are optimised or mis-entered.
Flats 3.5× more exposed than houses
Finally, dwelling type weighs heavily: 14.3% of flats carry a major inconsistency, versus 4.1% of houses — a 3.5× ratio. Condominiums, with their collective EPCs, shared areas and sometimes reconstructed envelope data, offer more room for anomalies.
A very uneven geography
The major-inconsistency rate varies sharply from one department to another. The map below shows, for each department, the share of EPCs carrying at least one major inconsistency.
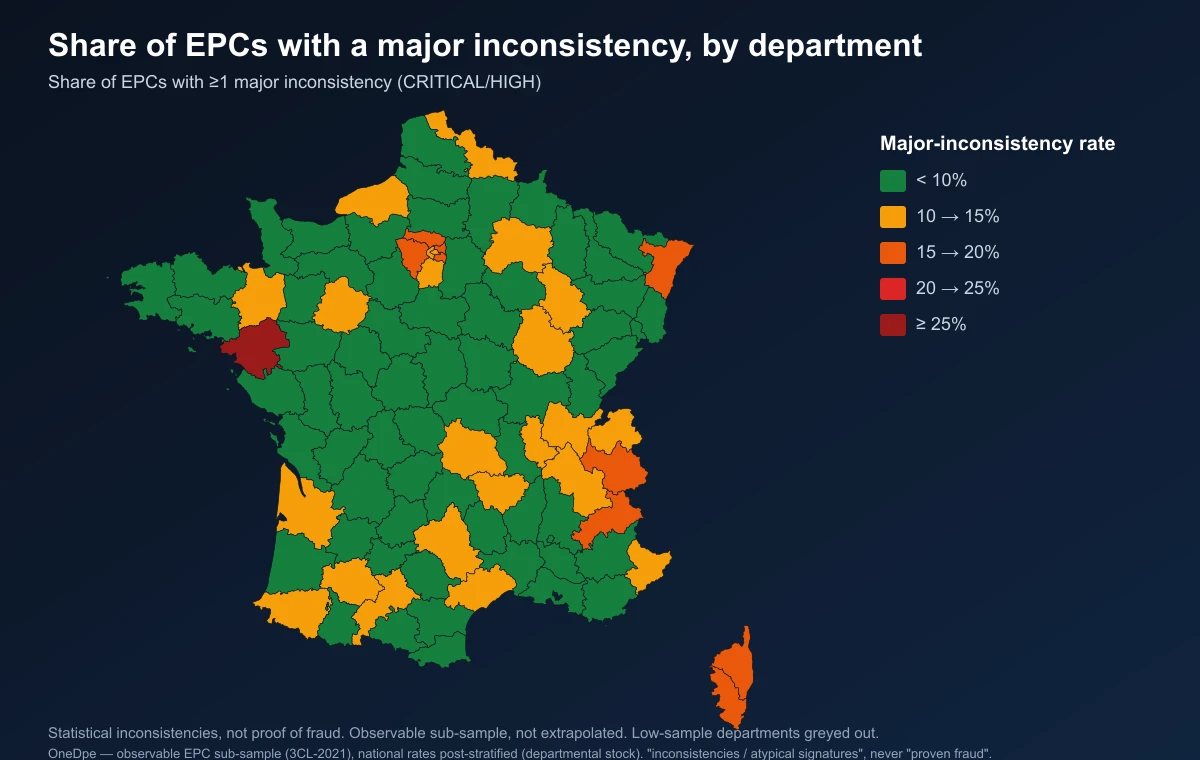
Most departments stay below the 10% mark, in line with the national average. A few territories stand out above 15%, without this proving questionable practices: the variation owes as much to the local stock mix (share of flats, building age, dominant classes) as to data-entry habits. The map is a starting point for investigation, not a verdict.
Atypical collective signatures
A separate investigation strand targets whole buildings whose units show abnormally uniform EPCs. Across 439,708 buildings of at least five dwellings, we flag 1,097 buildings (0.25%) with a characteristic "manual" signature: pre-2000 stock, at least five dwellings all rated A or B, all heated by electric convector heaters — a physically implausible combination. Broadening to old buildings with uniform energy rated A/B (which may include genuine whole-building renovations) reaches 4,061 buildings (0.92%). Here too, these figures flag cases to examine, not established fraud.
How this barometer was built
Methodological transparency is essential on so sensitive a topic. Here are the choices made.
Sample. We analysed 689,279 residential EPCs (houses and flats, 3CL-2021 methodology) from the open ADEME database, via systematic sampling covering all departments and the 2021-2026 vintages. This is an observable sub-sample: the findings describe that scope; they are not extrapolated to the entire national stock.
Weighting. So that national rates reflect reality, each EPC is weighted by the real share of its department and its vintage in the full stock (15.9 million EPCs). This post-stratification corrects sampling gaps: without it, over- or under-represented regions and years would distort the result.
Detection. Each EPC passes through the consistency engine that powers our EPC verification tool. An anomaly counts as "major" if it is of critical or high severity. Checks prone to false positives (missing value, mere information) are excluded from the rate.
Key points on the method: post-stratified rates (department × vintage) on an observable sub-sample of 689,279 EPCs. The wording used — "inconsistency", "atypical signature" — is statistical: it describes a gap to check, never proven fraud.
How to read your EPC before buying, selling or renovating
What should you do with these figures in practice? Here are the reflexes to adopt when facing a certificate.
The stakes are not merely documentary. A wrong label has a real cost: per our green-value estimates, a house rated G sells on average 15 to 22% less than an equivalent house rated D — i.e., on a home valued at €250,000, a discount of roughly €37,000 to €55,000. An inconsistent certificate can therefore skew a negotiation either way, wrongly trigger a rental ban, or lead to poorly targeted works. Measuring the discount linked to the EPC label first assumes that label is reliable.
Reflex no. 1 — Be wary of an A or B that is "too good"
An excellent label on an old home that has not been thoroughly renovated should raise a flag. Ask for proof of the insulation works and the detail of the equipment. It is precisely in classes A and B that the inconsistency rate is highest.
Reflex no. 2 — On new builds, check the envelope
For a recent home (after 2013), ask for the heat-loss values used. The barometer shows this is where Ubat-compliance gaps concentrate. A new EPC is not automatically a reliable EPC.
⚠️ In condominiums, be extra cautious. Flats concentrate more than triple the major inconsistencies of houses. A recent collective EPC, or a unit whose envelope has been reconstructed, deserves a second look.
Reflex no. 3 — Cross-check consumption against your bills
The EPC's conventional consumption is not your real consumption, but a massive gap (one to three times) is a signal. Compare the EPC estimate with the home's billing history when available.
Reflex no. 4 — Have the document's consistency checked
You do not have to recompute an EPC by hand. An automated consistency check reviews the same anomaly families as this barometer and tells you, point by point, what deserves a question to the assessor.
Check your EPC's consistency
Enter your EPC number or its data: the tool automatically checks the consistency between the label, the consumption, the heat losses and regulatory compliance, and flags each detected inconsistency with its severity level.
To go further: estimate the impact of a renovation on your label and the discount linked to a thermal sieve.
Conclusion
With roughly 1 EPC in 9 carrying a major inconsistency, the certificate remains a document to handle with discernment — without lapsing into a blanket fraud accusation, which the data do not support. The anomalies concentrate in precise, identifiable areas: classes A/B, recent stock, flats. These are all cases where a check is warranted before signing or committing to spending.
The right reflex is not to distrust every EPC, but to know which ones deserve a second look. OneDpe's EPC verification applies the exact grid of this barometer to your document, turning a vague doubt into a list of points to clear up.