A home rated A or B is reassuring — except when an entire 1990s building, heated by electric convectors, shows the same flattering label across dozens of units. That profile is physically very unlikely without heavy, documented renovation. We searched for these profiles in France's national database of energy performance certificates (EPCs, the French DPE) — more than 16 million certificates — and drew a map from it: the map of the departments where clusters of suspect EPCs concentrate.
"Suspect" does not mean "fraudulent." An abnormally good label can come from a real renovation invisible in our data. But when five or more units of the same old building combine an A/B rating with a heating system that normally cannot achieve it, the signature deserves a second look. This is exactly what the State now seeks to spot: since 2023, France's energy agency (ADEME) has run an AI tool that flags statistically atypical EPCs.
About 1,100 buildings in the analysable sub-sample show the signature hardest to explain other than by over-rating: built before 2000, at least five units rated A or B, all on direct electric heating (convectors). 764 of them meet the strictest criterion.
What this article covers
The regulatory tightening on EPC control (reliability plan, reinforced checks, AI detection, QR code), the method by which we identify a "suspect cluster" and how we discard false positives, the resulting departmental map and how to read it honestly, four real anonymised cases, the four interpretation mistakes to avoid, and how to check your own building's consistency.
EPC control is tightening in 2026
The EPC has been enforceable since 1 July 2021: its information engages the liability of the seller (article L.271-4 of the Construction and Housing Code) and the landlord (article L.126-29). A wrong certificate can therefore ground a claim against the assessor (tort liability, article 1240 of the Civil Code). Against this backdrop, the State launched an EPC reliability plan, presented on 19 March 2025, built on three pillars: better detection, better control, better training.
| Lever | Measure | Reference / source |
|---|---|---|
| Detection | ADEME AI tool (since 2023) flagging atypical EPCs (too fast, ratings at threshold limits) | ecologie.gouv.fr |
| Controls | Scaling up: ~3,000 (2023) → 8,000 (2024) → target 10,000 assessors audited (2025) | Reliability plan, 19/03/2025 |
| Sanctions | Roughly 500 to 557 certifications withdrawn since 1 July 2024; re-registration barred for 18 months | Ministry communication, 03/2025 |
| Overproduction | Beyond 1,000 EPCs over 12 rolling months, the assessor can be suspended | Decree of 28/07/2025 |
| Authenticity | QR code mandatory on the EPC (since September 2025) linking to the ADEME page; 13-character registration number | Decree of 16/06/2025 |
The message is clear: public authorities now hunt the statistical signals of inconsistency. Our map materialises geographically what that detection targets — without replacing it, and with no accusatory value.
How we spot a "suspect cluster" (and discard false positives)
The principle: a single EPC proves nothing. We reason at the building level, grouping the certificates of one address produced with the same calculation method (3CL-2021). A building is flagged "suspect" when it combines a physically implausible content pattern and a concentration — never on a single signal.
This scale changes everything. With more than 16 million certificates — most of the residential stock assessed since the 2021 reform — it is the largest workable corpus in France for this kind of analysis. Where public reliability studies work on a few hundred dwellings, and the State detects case by case, we can reason building by building across almost the entire stock, then aggregate department by department. It is this granularity — not any privileged access to some "list of fraudsters" — that makes the map original.
The most robust signature: old stock "too well rated"
The profile hardest to explain other than by over-rating: a building constructed before 2000, with at least five units rated A or B sharing the same heating. When that heating is direct electric (convectors), reaching class A or B on old stock is physically very unlikely without heavy insulation — which would leave traces (invoices, voted works). It is the signature of the four real cases we checked manually.
Why does a convector not "make" a class A? Because the label depends on primary-energy consumption per square metre: direct electric heating, even with the conversion factor lowered to 1.9 since January 2026, remains energy-hungry on poorly insulated stock. Reaching A or B requires a very efficient envelope — insulated walls and roof, recent windows — which, on a never-renovated 1990s building, cannot be improvised. When dozens of units nonetheless show that combination, the simplest explanation is not real performance.
Four families of signals, never just one
Electric heating on old stock is not the only pattern. Our detectors combine four families of signatures, always crossed with a concentration: a repeated profile (identical generator, label and age band across at least five units), an aberrant floor area (the whole building's area copied onto an individual unit), a construction year that diverges sharply from the building's median, or a same-day concentration of certificates. This last signal, on its own, proves nothing: it occurs naturally on about a quarter of buildings, and is therefore never used in isolation — only to reinforce an implausible content pattern.
From raw to "smoking gun": discarding false positives
Our method favours precision over recall: better to miss a doubtful case than wrongly flag an honest building. We therefore tighten the criterion step by step, as the figure below shows.
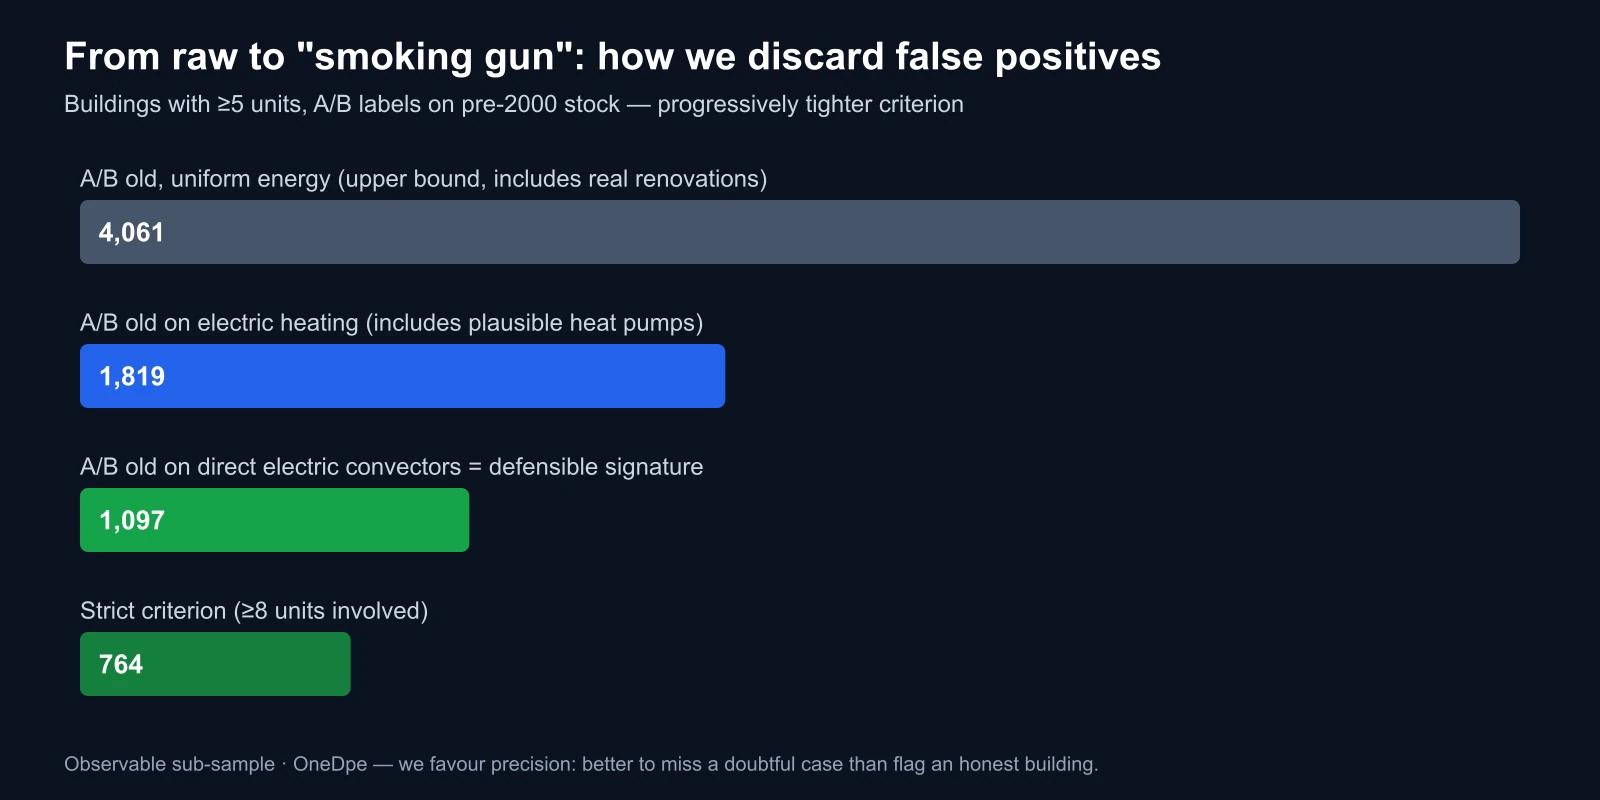
The limits, stated upfront. The first possible false positive is a real heavy renovation (condominium external insulation, connection to a district heating network) not declared to ADEME: it produces the same figures with no fraud at all. Our results also cover the observable sub-sample — buildings with enough comparable certificates — and are never extrapolated to the national stock. Per-department rates are computed on analysable buildings, and low-sample departments are greyed out.
What the map reveals
Of the 439,708 analysable buildings (at least five units, 3CL-2021 method), the defensible signature concerns about 1,100 buildings — 0.25% of the sub-sample. Small in proportion, but heavily concentrated geographically: Mediterranean and high seasonal-rental departments (Aude, Gard, Var, Alpes-Maritimes, Pyrénées-Orientales) show the highest rates, several times the average.
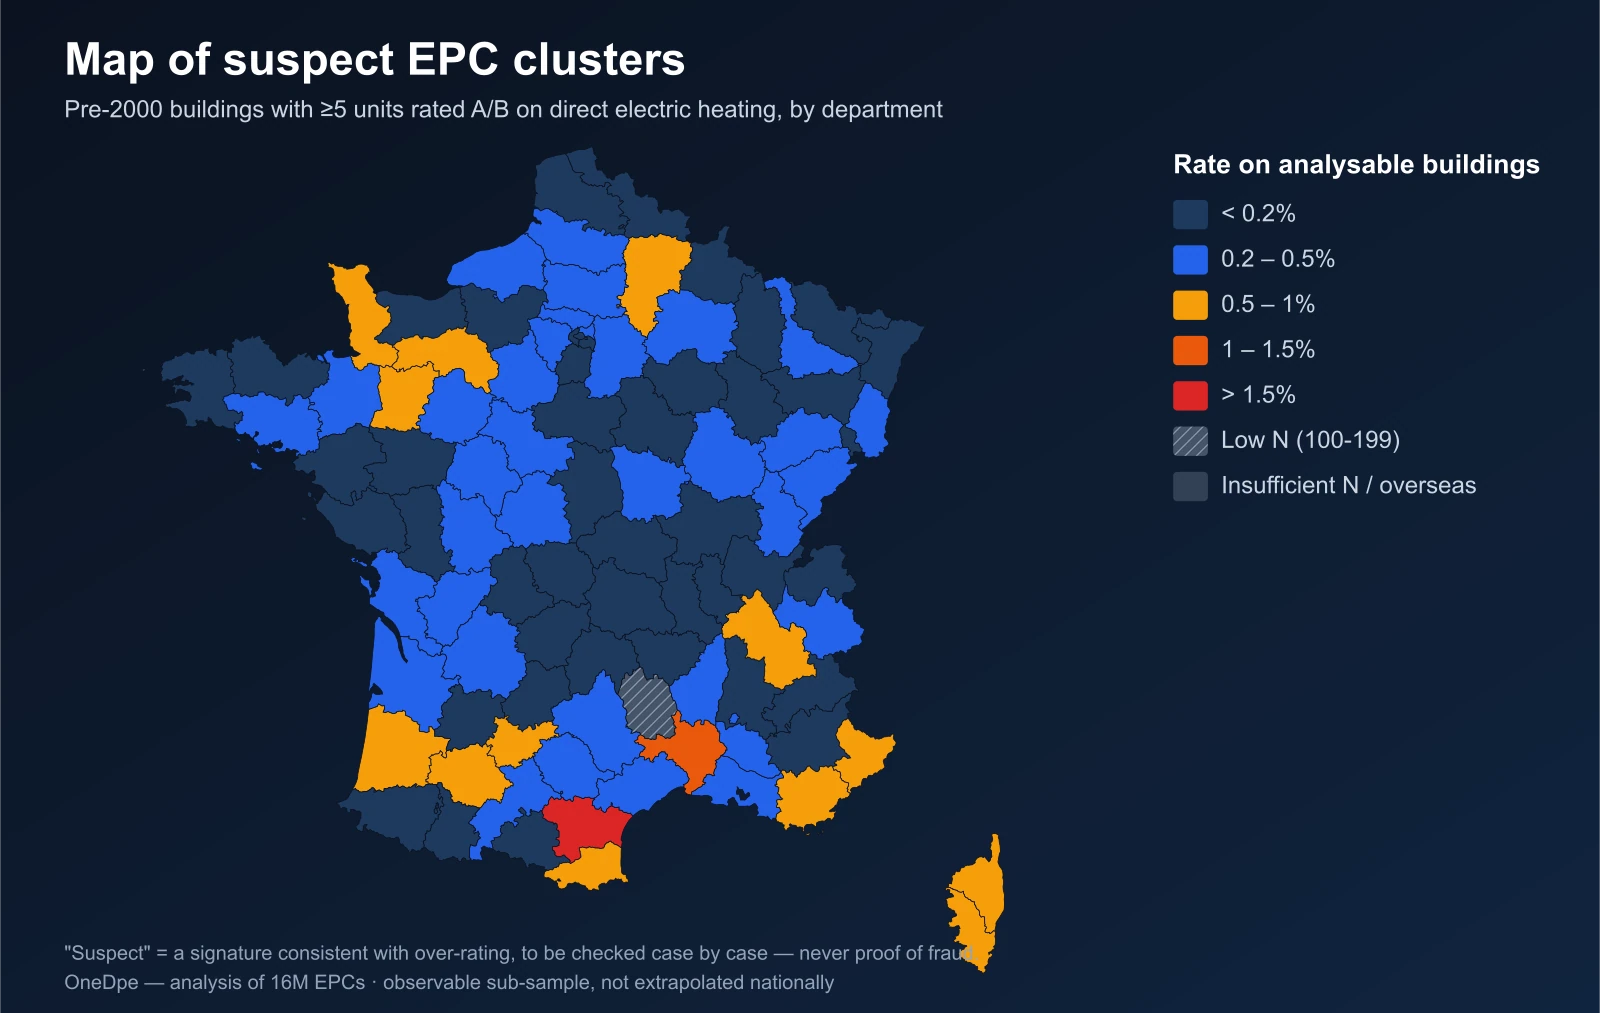
This geography has a logic: tourist areas concentrate old residences let seasonally, where the incentive to display a "good" label — to keep letting despite the ban on energy sieves — is strongest. The map names no one; it shows where to look.
This pressure has a regulatory cause. Since 1 January 2025, a class-G home can no longer be offered for rent; F follows in 2028, E in 2034. For an old property intended for letting, the gap between an F label and a C or better is no longer cosmetic: it governs the right to let. That is precisely where the over-rating risk is highest — and why the decree of 28 July 2025 now caps how many certificates a single professional may produce: beyond 1,000 over twelve rolling months, their certification can be suspended.
A word, finally, on what the map does not say. A lightly coloured department is not "more honest": it may simply have fewer buildings diagnosed enough to be analysed, or newer stock where the signature does not apply. Conversely, a heavily coloured department reflects a high density of old condominiums as much as any excess of complacency. The map ranks zones to examine; it does not rank territories by virtue.
Four real signatures (anonymised)
We manually verified several buildings combining these signals. All are described without address, condominium name or assessor name — only by their conurbation and technical profile.
- A seaside residence in south-east France, 2010s: several electric-convector units rated A/B.
- A building in eastern France: several units with an identical, abnormal floor area — the whole building's area appears copied onto each unit — rated A on a condensing boiler.
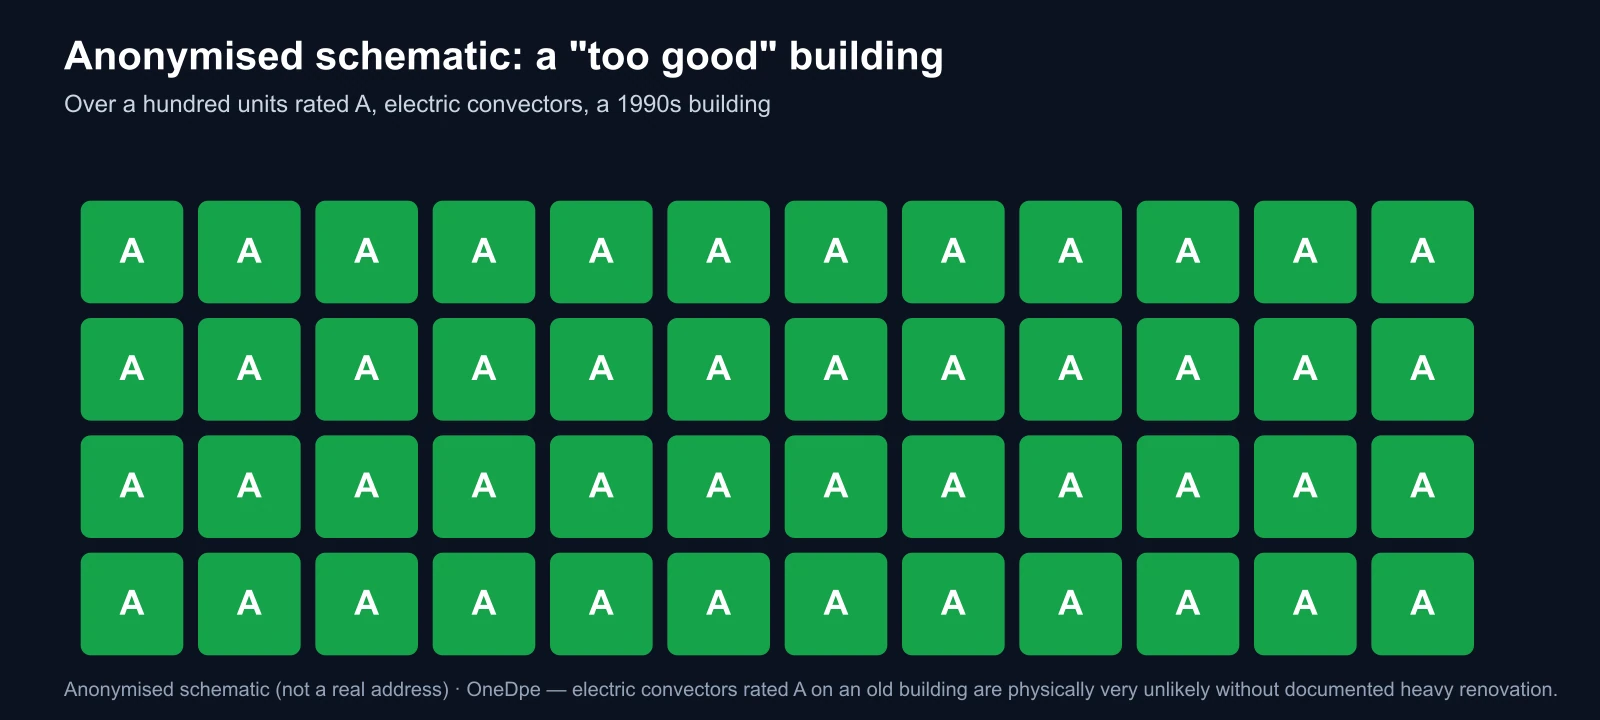
- A very large Paris condominium, 1990s: over a hundred units rated A on electric convectors.
- A small overseas building, mid-20th century: all units rated A on a condensing boiler.
These signatures are suspect and call for verification; on their own they do not constitute proof of any irregularity. A genuinely documented heavy renovation would explain the same figures.
The 4 interpretation mistakes to avoid
Mistake 1 — Reading "suspect" as "fraudulent"
A statistically atypical profile is not fraud: it is an inconsistency to confirm case by case. Our map is a vigilance tool, not a verdict.
Mistake 2 — Believing a class A is necessarily good news
If you buy on the strength of an over-rated EPC, you inherit a home that is more energy-hungry — and harder to let or resell — than the label suggested. A second opinion before buying costs far less than a nasty surprise.
Mistake 3 — Not checking the certificate's authenticity
Every valid EPC carries a 13-character ADEME registration number and, since September 2025, a QR code linking to the official page. A missing or unrecognised number is an immediate red flag.
⚠️ Caution: a complacent EPC does not benefit the buyer or tenant — it exposes them. Always compare the label with similar properties in the same area and with the building's physical consistency (year, insulation, heating) before deciding.
Mistake 4 — Thinking nothing can be done
In case of serious doubt, you can request a counter-assessment from another certified professional, then report the certificate to the body that certified the assessor, to ADEME (via the EPC observatory) or to the DGCCRF (SignalConso). Where the loss is quantifiable, the assessor's liability can be engaged — see our guide on remedies for an inaccurate EPC.
Check your building's consistency
Paste your EPC number and compare your home with the other units in your building: labels, heating energy, overall consistency. The tool flags whether your building shows a statistically atypical signature worth a second opinion — no accusation, with the limits spelled out.
Going further: the 7 signs of a sloppy or over-rated EPC and the specific case of condominiums, collective versus individual EPCs.
Conclusion
The map of suspect EPCs denounces no one: it shows where statistically improbable profiles concentrate, on what method, and with what limits openly stated. As the State tightens its controls and the EPC governs the right to let, reading these signals protects buyers and tenants alike — and the market as a whole.
The useful reflex: before any purchase or letting, check the certificate's authenticity and compare it with its building. The OneDpe EPC check does it for you and points out the inconsistencies to resolve.