In France, one letter decides the fate of a home: whether it can be let, at what rent, with what grants. Bands F and G, the “thermal sieves”, trigger a rent freeze and, step by step, a ban on letting. What the letter is worth therefore depends on how reliable the certificate behind it is.
We looked at how French energy performance certificates (DPE) are spread around the band F line, across 9.8 million certificates issued between 2022 and 2025, and compared them with England and Wales, which have applied a similar rule since 2018.
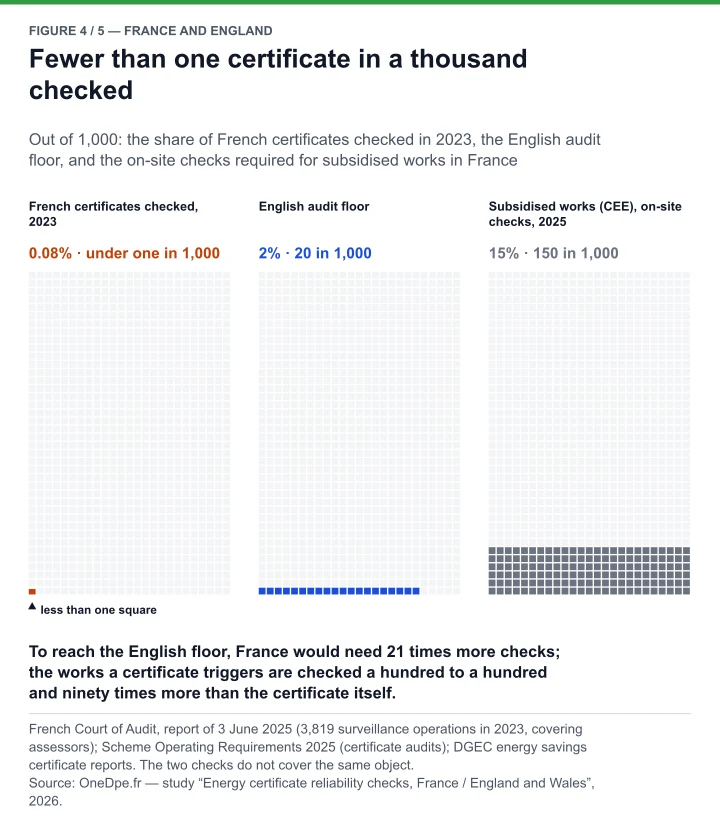
At the band F line, 7 certificates in 10 fall on the favourable side, against 1 in 2 elsewhere on the scale — 33,449 more certificates than expected, out of 9.8 million. And, according to the Court of Audit, fewer than one certificate in a thousand checked in 2023.
What this article covers
What ADEME’s public data show at the band F line, the evidence that the effect follows the rule, what England can measure and France cannot, what to check on your own certificate, then certificate checks and four measures to find out what a certificate is worth.
Just short of band F, 7 certificates in 10 fall on the favourable side
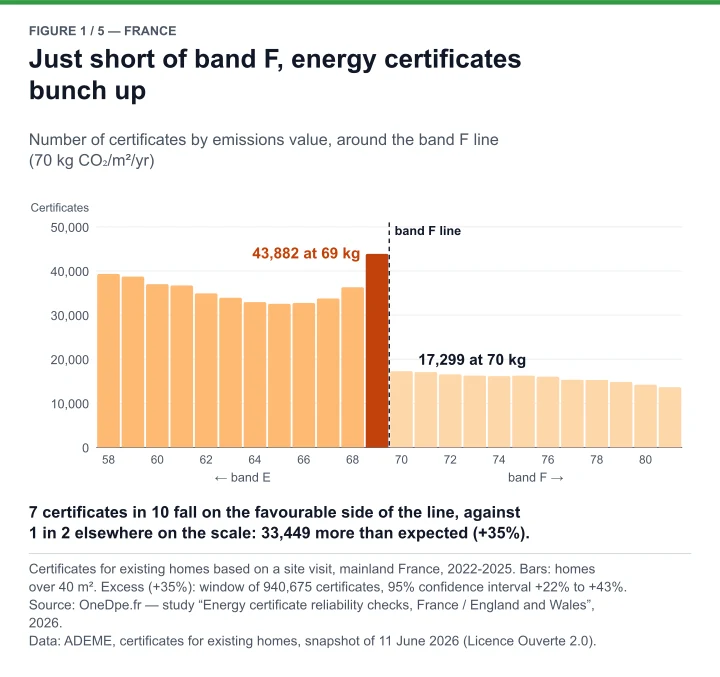
A French certificate carries two ratings: energy use and greenhouse gas emissions. The label takes the worse of the two. On the emissions axis, a home enters band F at 70 kg of CO₂ per m² per year.
If certificates were spread without regard to this line, there would be roughly as many homes at 69 kg as at 70 kg. There are not. Among homes over 40 m², 43,882 show 69 kg, the last value of band E, and only 17,299 show 70. That is 72% on the favourable side, against 51% on average at the other values of the scale. We ran the same calculation at 131 points of the scale where no line falls: none exceeds 56%.
Compared with what the curve predicts, there are 33,449 more certificates than expected near the line: +35% (range +22% to +43%). The gap stays positive in all 948 different ways of doing the calculation that we tested. The same pattern appears, more weakly, at the band E line (+21%).
This kind of threshold effect is not unknown: the French Council of Economic Analysis (CAE) measured it in 2024 on the energy label, up to the end of 2023. The climate label, the emissions one, was not covered there.
When the line moves, the bunching follows
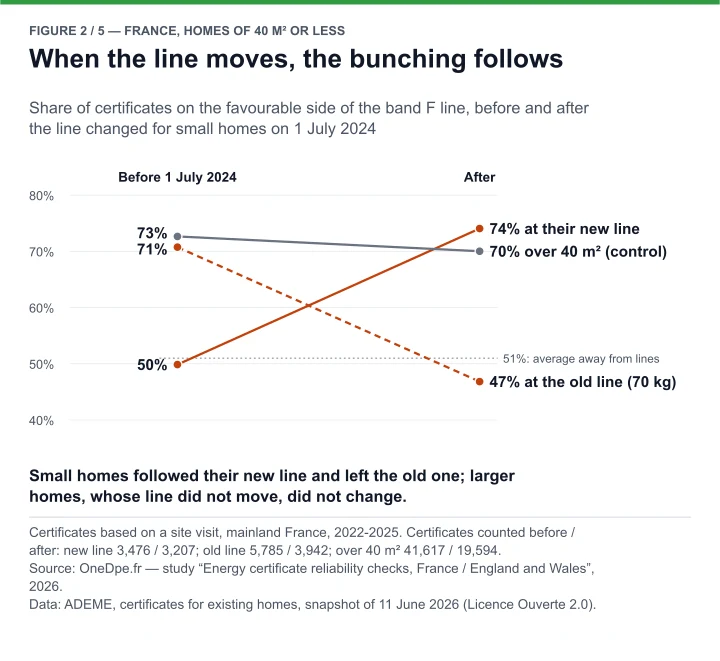
Bunching near a line can have innocent explanations, such as a liking for round numbers. The reform of 1 July 2024 makes it possible to check. On that day, homes of 40 m² or less received band lines specific to their floor area. Other homes saw no change.
Among small homes, the share on the favourable side of their new line rose from 50% to 74%. At the same time, at the old 70 kg line that no longer applied to them, it fell from 71% to 47%. Among larger homes, nothing moved: 73%, then 70%. And for 98.9% of these small homes, the new line is not a multiple of ten: a liking for round numbers explains nothing.
In England, the anomaly exists only where the rule applies
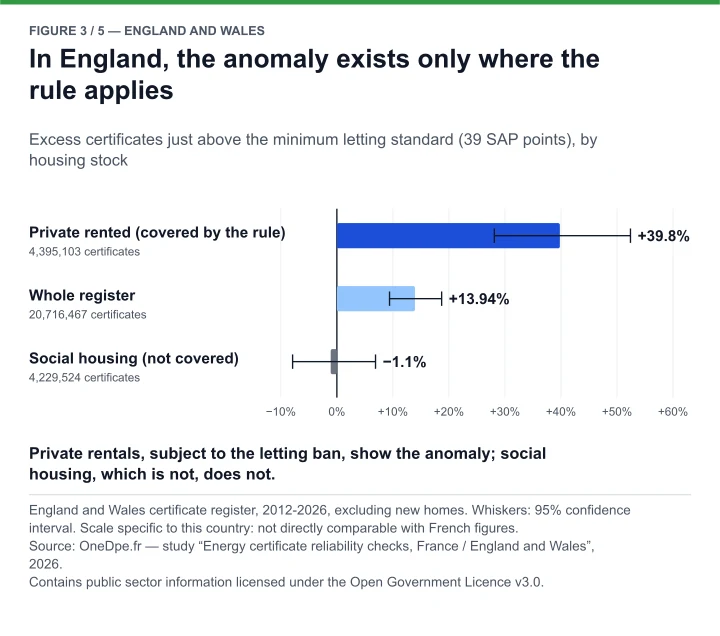
In the private rented sector of England and Wales, a home rated F or G has been barred from new tenancies since 2018, and from all tenancies since 2020. Social housing is not covered. Both appear in the same register, on the same dates, on the same scale.
The result is clear: at the letting threshold, the excess reaches +39.8% in private rentals and is nil in social housing (−1.1%). Where the rule requires nothing, the pattern disappears.
This comparison is impossible in France. The British register records whether a home is rented or owner-occupied; the French database does not. Since July 2021 it no longer distinguishes sales from lettings, and it no longer records who issued the certificate.
Your certificate is close to band F: what should you check?
Nothing in this study says your certificate is wrong: it describes millions of rows, never an individual case. But if your home sits just on a band line, and that band matters to you (sale, letting, rent), it is worth checking that the certificate’s data match your home: floor area, year of construction, insulation, heating.
What to check on your DPE: the living area, the heating and hot water systems, the declared insulation of walls, loft and windows. A single wrong input can change the band.
Check my certificate’s consistency for free
From your certificate number, the tool re-reads the data filed with ADEME. It is a warning signal, not a verdict.
If an error is confirmed, our guide on the assessor’s liability and your remedies sets out the steps.
Fewer than one certificate in a thousand checked in 2023
In 2023, according to the French Court of Audit, 0.08% of certificates were checked: 3,819 surveillance operations on assessors, 937 of them on site. No official figure has been published for 2024 and 2025. In England and Wales, at least 2% of certificates must be audited every year. The two systems do not check the same object: the assessor in France, the certificate across the Channel. Reaching that volume would nonetheless take 21 times more inspection operations, about 80,000 a year.
The contrast also exists within France. Works funded by energy savings certificates must be checked on site in 10% to 15% of cases depending on the year: a hundred to a hundred and ninety times more than the certificate that triggers them. It is not the same object (a works operation on one side, an assessor on the other): this compares instrumentation, not probity. Across the Channel, an audit fails beyond a set margin and the faulty certificate is replaced. In France, no tolerance is published, and no rule requires a faulty certificate to be withdrawn. France does have two rules England lacks: three of the six checks on an assessor take place on site, and since October 2025 ADEME automatically flags anomalies to the bodies that certify assessors.
Certificate checks: four measures to find out what a certificate is worth
The EU Energy Performance of Buildings Directive (2024/1275) requires an independent control system ensuring that at least 90% of certificates are valid, measured by random sampling, together with publication of the number of certificates assessed. It was due to be transposed by 29 May 2026; to our knowledge these provisions have not been. Four low-cost measures would show at last what a French certificate is worth; the directive requires the first, and the other three already exist across the Channel:
- publish every year the number of certificates checked, the inspection rate and the failure rate;
- set and publish a numerical tolerance beyond which a check fails;
- record in the ADEME database whether a home is rented or owner-occupied;
- if a cost-based exemption is introduced, keep it in a public register.
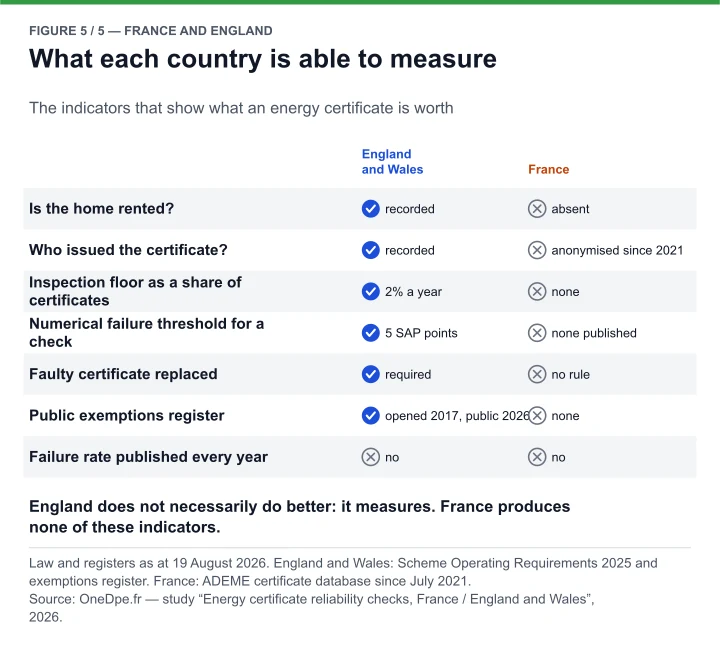
What these figures do not say: +35% does not mean that 35% of certificates are wrong: it is 33,449 more certificates than expected just short of band F, out of 9.8 million. These certificates are not disguised energy sieves: the study does not say which class these homes should have. “7 in 10” concerns certificates one unit from the line, not all certificates. No professional is blamed: the study cannot decide between input data adjusted near the line and unfavourable certificates more often removed from the published database. Nor does it say that English certificates are more reliable: neither country publishes the failure rate of its checks.
The full study, its tables and its method note are on its press page. An earlier article compares inspection systems across Europe, rule by rule.